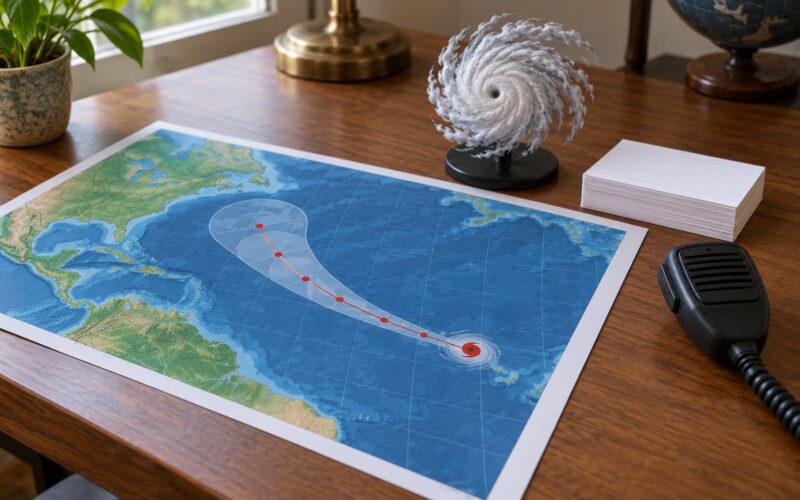
Forecasters estimate a snowfall total by predicting how much liquid water a storm will deposit, checking whether that water stays frozen all the way to the ground, then multiplying the liquid amount by an estimated snow ratio. They run that whole calculation many times with slightly different assumptions, compare the results, and publish the outcome as a range with a probability attached.
That is how snowfall totals are forecast, and it explains most of the behaviour readers find puzzling: why a number keeps moving between updates, why two towns 20 miles apart get very different totals, and why a forecast that said 6 inches can end up delivering 2. Snow is harder to nail down than temperature because a small error in liquid precipitation, or in the temperature profile, gets multiplied by a ratio of 10 or more before it reaches the ground as snow depth.
This guide walks through that process in order: what forecasters look at, what the models actually do, why snow ratios swing so widely, and how to read a forecast range so you know how much confidence to put in it.
Updated for October 2026.
Table of Contents
- How Snowfall Totals Are Forecast
- What Data Meteorologists Use to Forecast Snow
- Satellites
- Surface weather stations and automated reports
- Upper-air soundings
- Radar
- Aircraft and marine reports
- How Weather Models Estimate Snowfall Amounts
- Deterministic models
- Data assimilation builds the starting point
- Ensemble models
- Why forecasters never quote a single model number
- Why Snow Ratios Change the Forecast
- How Storm Tracks and Timing Affect Accumulation
- Track and speed
- Moisture availability
- Warm layers and the rain-snow transition
- Convective banding
- How Local Terrain Changes a Snowfall Forecast
- Elevation and slope orientation
- Valleys and cold pools
- Large water bodies
- Cities and the coastline
- What Do Snowfall Probability and Forecast Ranges Mean?
- The percentage is not a coin flip
- How to read a range
- Scenario maps
- How Far Ahead Snowfall Totals Can Be Forecast
- Where forecasts most often go wrong
- Frequently Asked Questions
- What is the most accurate snowfall model?
- How accurate are meteorologists’ snowfall predictions?
- What does a 20:1 snow ratio mean?
- How many inches of snow does it take to equal 1 inch of water?
- How many inches of snow equals 3 inches of rain?
- Why do different weather apps show different snow totals?
How Snowfall Totals Are Forecast
The whole process can be reduced to eight steps, and they repeat roughly every six hours as new observations come in.
- Track the storm. Models project where the low-pressure centre and its moisture plume will be at each forecast hour.
- Read the temperature profile. Forecasters examine every level of the atmosphere to see whether precipitation forms as snow, falls as rain, or melts and refreezes on the way down.
- Locate the snow level. The snow level sits roughly 1,000 feet below the freezing level, though that offset shifts with the storm’s moisture content.
- Estimate liquid precipitation. The quantitative precipitation forecast gives the water depth in inches, the same number used for rain.
- Apply a snow ratio. That liquid figure is multiplied by a ratio between roughly 5:1 for wet heavy snow and 20:1 for dry powder.
- Adjust for terrain. Elevation, slope orientation, valleys and large water bodies shift the total up or down across short distances.
- Run an ensemble. The same setup is computed many times from slightly different starting points to reveal how confident the outcome really is.
- Blend with observations and publish. Radar, satellite and surface reports are merged in, then forecasters issue probability and storm-total products.
The end result is rarely one number. It is usually a statement like “3 to 5 inches of snow, with a 60 percent chance of at least 2 inches,” which describes both the likely outcome and the spread around it.
What Data Meteorologists Use to Forecast Snow
No forecast exists without observations underneath it. Models are run from observed starting conditions, and the quality of a snow forecast starts with how well the current atmosphere has been sampled.
Satellites
Geostationary imagers watch cloud tops and measure brightness temperature, which gives a regional picture of the storm’s structure and how high the cloud shield is. A very cold, high cloud top over a moisture-rich low-level flow is one of the classic heavy-snow signatures.
Surface weather stations and automated reports
Cooperative observers, airport automated stations and community reporting networks record temperature, pressure, wind and precipitation type around the clock. These observations get quality-controlled and then fed back into the models, which is why forecasts improve through the day.
Upper-air soundings
Weather balloons carrying a radiosonde release twice daily, with much more frequent launches during active storms. Each profile plots temperature and moisture at every altitude, and forecasters read the snow level and the warm nose structure directly off the skew-T log-p diagram.
Radar
Widespread dual-polarization radar measures reflectivity and, crucially, the shape of falling particles, which lets forecasters distinguish snow from rain. Once precipitation reaches the surface, radar becomes the main tool for nowcasting the next hour or two.
Aircraft and marine reports
Airliners submit special reports as they pass through the storm, giving pilots and forecasters both an eyeball and an onboard radar estimate of precipitation rate, ice and freezing level. Ships and buoys matter less often, but they are the only data source over open ocean.
Stream gauges and soil moisture add a final layer, since absorbed ground water eventually limits how much snow melts and runs off during a storm.
How Weather Models Estimate Snowfall Amounts
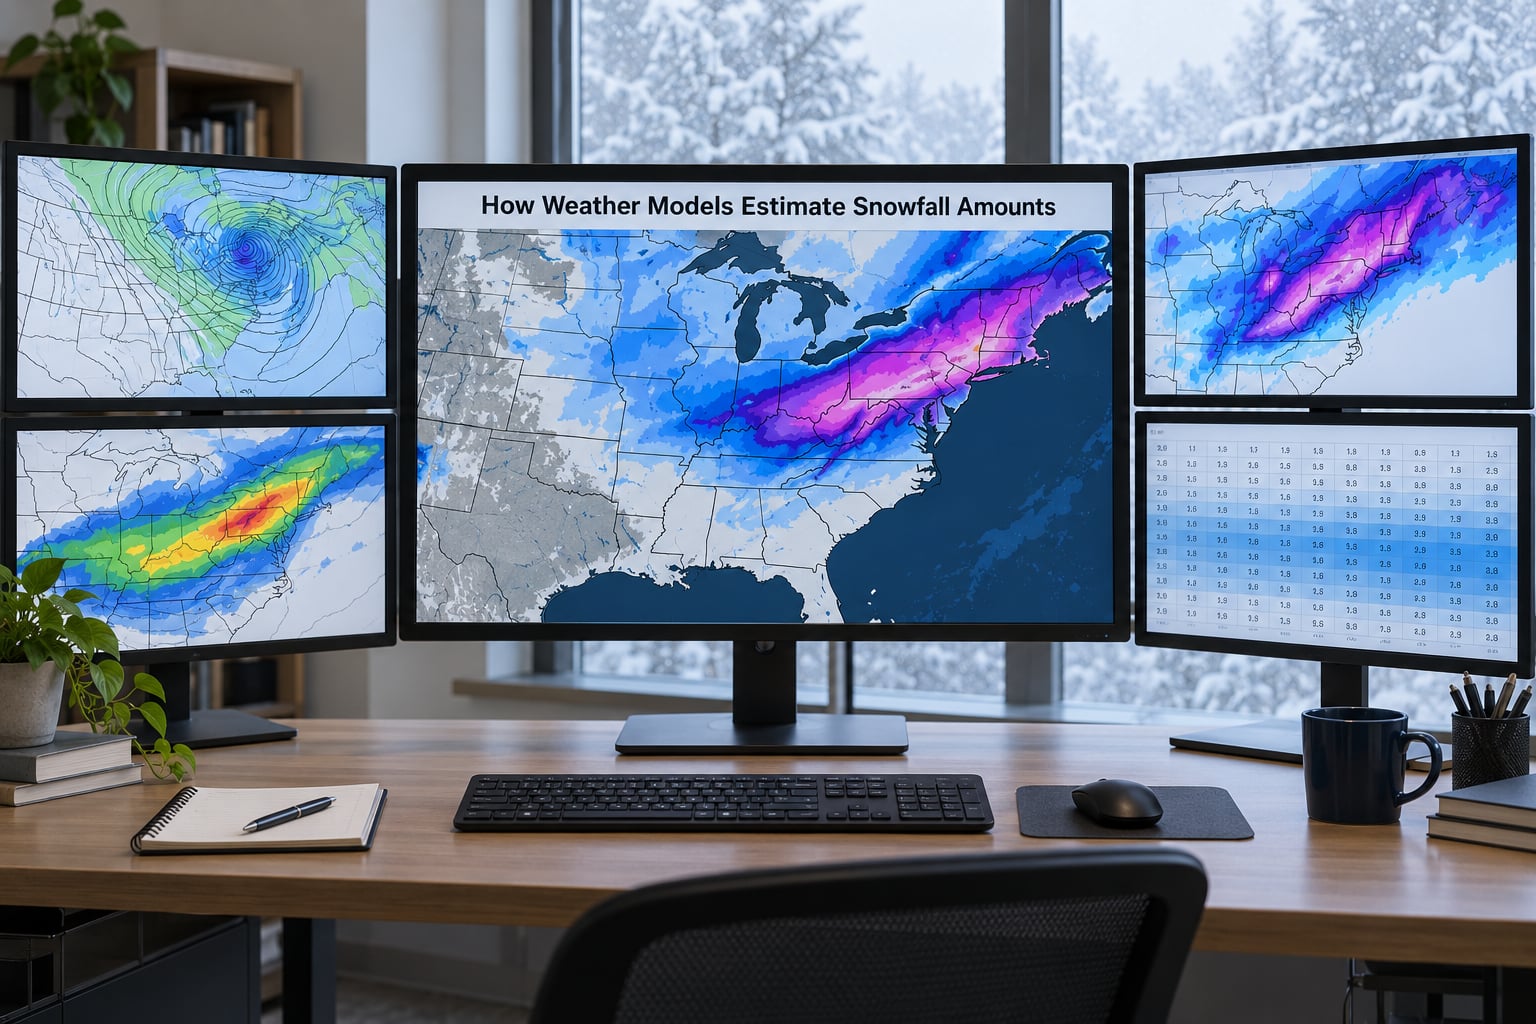
Models do not predict snow. They predict the atmosphere, including temperature, moisture and motion, and a forecaster reads snow out of that output.
Deterministic models
A deterministic run solves the equations of atmospheric motion and physics on a grid. The National Weather Service’s Global Forecast System and the ECMWF model are the two most widely used global runs, and higher-resolution regional models such as the High-Resolution Rapid Refresh run over North America at kilometre-scale spacing.
The catch is initial condition uncertainty. The atmosphere is chaotic, so tiny errors in the observed starting state grow as the forecast runs forward, and a single deterministic run gives no honest measure of how wrong it might be.
Data assimilation builds the starting point
A model cannot begin without knowing what the atmosphere looks like right now, and that is what data assimilation does. The previous forecast, plus every recent surface, radar, satellite and upper-air observation, are combined into one physically consistent three-dimensional estimate of temperature, moisture and wind. That synthetic snapshot becomes the model’s starting state, and it is why every new observation can change an outcome that was hours away.
Ensemble models
An ensemble solves the same equations many times, each run nudging the initial conditions, model physics or resolution slightly. If twenty runs put the storm track within 30 miles of each other, confidence is high. If they scatter across 200 miles, the forecast office says so instead of pretending to a precision it does not have.
Why forecasters never quote a single model number
A modern snow forecast blends several global and regional runs, applies statistical calibration learned from past errors, and then adds a hand edit from a forecaster who has just looked at the latest radar and soundings. Skill scores consistently show blended and human-corrected output beating any individual model, which is why the National Weather Service calls the blended products its preferred guidance.
Why Snow Ratios Change the Forecast
The snow ratio, also called the snow-to-liquid ratio, is the number of inches of snow produced by one inch of liquid water. It is the single biggest reason a snow forecast is less certain than a rain forecast, because the model knows the liquid water better than it knows the snow.
The ratio is driven by temperature through the cloud, humidity, wind and how long the snowflakes fall. Cold, dry air high in a deep cloud builds large, light dendrites and pushes the ratio toward 20:1 or higher. A shallow, near-saturated cloud with temperatures close to freezing produces small, wet, dense flakes and ratios near 5:1.
| Snow type | Typical ratio | 0.25 in liquid | 0.50 in liquid | 1.00 in liquid |
|---|---|---|---|---|
| Wet, heavy snow near freezing | 5:1 | 1.25 in | 2.5 in | 5 in |
| Average settled snow | 10:1 | 2.5 in | 5 in | 10 in |
| Cold, dense snow | 15:1 | 3.75 in | 7.5 in | 15 in |
| Dry powder, very cold | 20:1 | 5 in | 10 in | 20 in |
The practical consequence is stark. Two equally confident liquid forecasts of 0.30 inch become 1.5 inches of snow at a 5:1 ratio and 6 inches at 20:1, with no error in the precipitation forecast at all.
Liquid water equivalent, usually shortened to SWE, is the way forecasters and hydrologists talk about snow when water supply matters rather than depth. A snowpack holding 6 inches of water equivalent is far more useful to a reservoir manager than the same pack described as 60 inches deep. This is also the number ski areas and water managers measure directly with a snow sampler.
That comparison matters for another reason. Forecasters verify what actually fell, and the standard method is not the ruler by the fence. A snow ruler reading is recorded, then the snow is melted and the resulting water measured with a graduated cylinder, which gives the liquid water equivalent of what fell since the last observation. Sleet, freezing rain and the melting that happens during a storm all corrupt a simple depth reading, which is why a ruler alone understates totals in messy conditions.
How Storm Tracks and Timing Affect Accumulation
Snow accumulates where the storm delivers moisture to the surface at a steady rate, and the same storm can behave very differently along its path.
Track and speed
A slow-moving storm drags its moisture source over one place for hours, while a fast one sweeps past and can deposit the same total in a fraction of the time. Both can produce a good total; what changes is how long accumulation lasts and how well the forecast can pin down the timing.
Moisture availability
Snow is efficient precisely because it holds very little water, so even modest moisture can produce impressive depths. Coastal storms drawing moisture from a warm ocean can push ratios down while delivering heavy totals, and inland storms over dry cold air can deliver very deep snow from surprisingly small amounts of liquid water.
Warm layers and the rain-snow transition
The hardest part of a winter forecast is often not the snow itself but the temperature profile between the cloud base and the ground. A layer of warm air a few thousand feet above the surface melts snow to rain, which may refreeze into ice when it lands. Those few hours decide whether a town gets a foot of snow, an inch of ice, or nothing at all.
Convective banding
Thunderstorms that form along a front or a terrain-forced convergence line produce narrow bands of very heavy snowfall. Bands a few miles wide can dump a foot while the town just outside them gets two inches, and their exact position is often impossible to pin down more than a few hours ahead.
How Local Terrain Changes a Snowfall Forecast
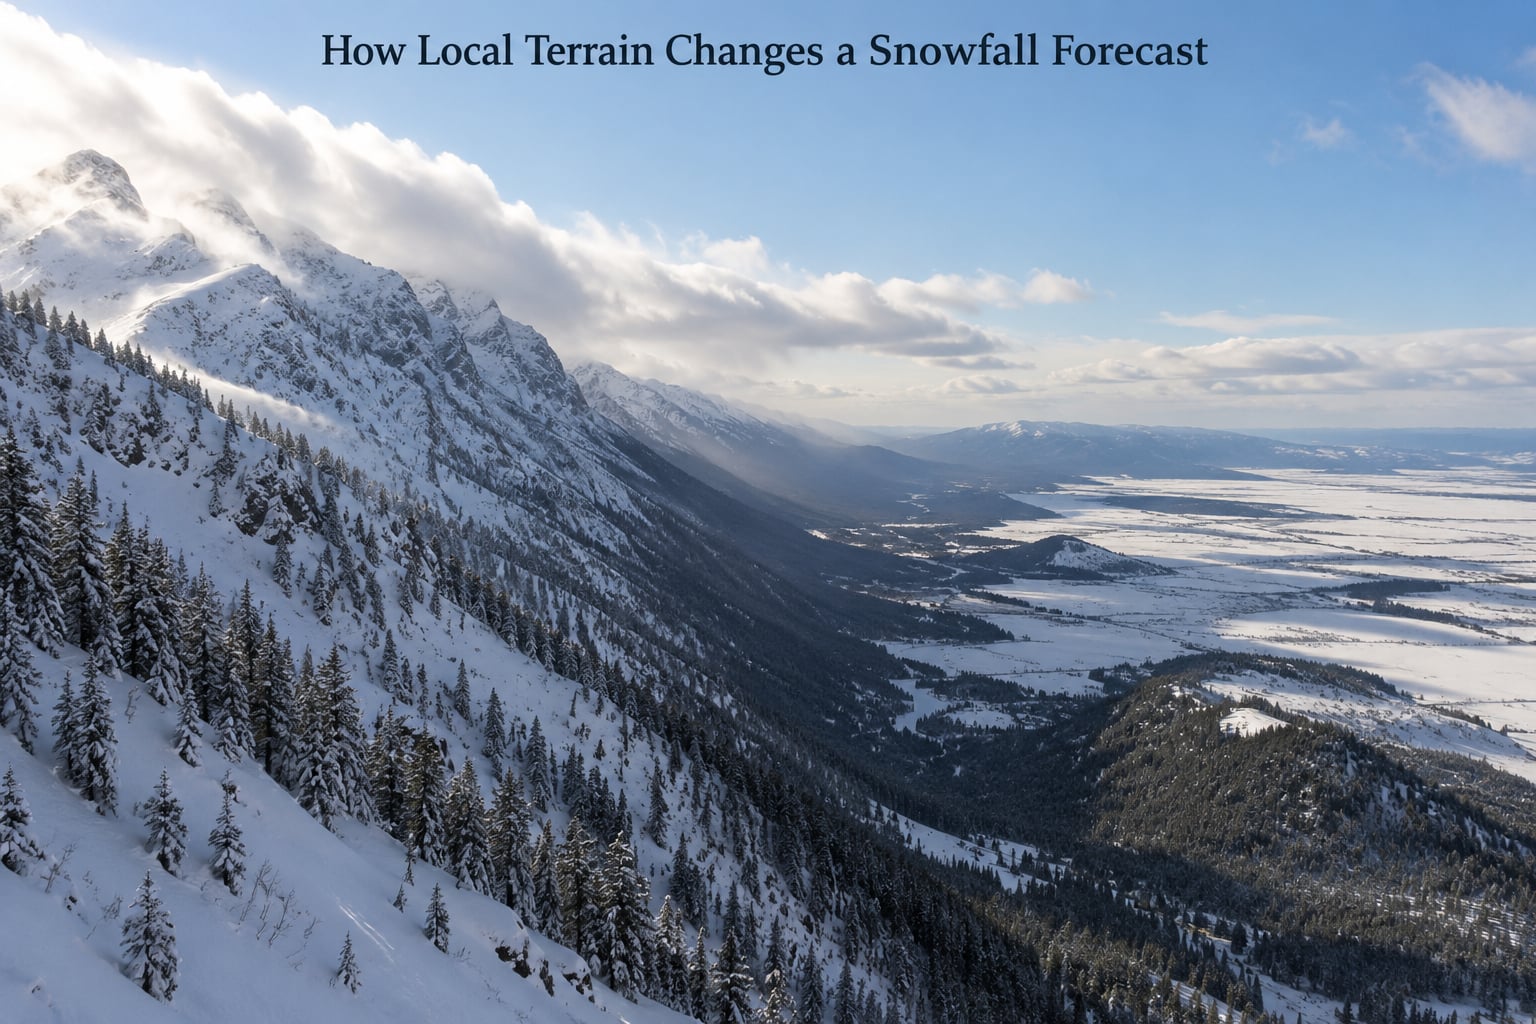
A single headline total rarely applies across an area of more than a few miles, because the ground itself changes what falls on it.
Elevation and slope orientation
Higher ground sits deeper inside the cold layer, so it usually accumulates more, and a slope facing the storm’s wind gets forced upward and dumps its moisture as snow. That orographic lift is why the windward side of a ridge can take double what the lee side receives only a short distance away.
Valleys and cold pools
Cold, dense air drains downhill and pools in valleys and low spots overnight, which can hold temperatures below freezing after the surrounding hills have already crossed into rain. Forecast zones often split along exactly this line.
Large water bodies
Lake-effect and sea-effect snow is its own mechanism. Cold air passing over an unfrozen lake picks up heat and moisture, forms clouds downwind, and produces very localized, very intense bands that can deliver totals no general grid forecast captures well.
Cities and the coastline
Urban areas retain heat from buildings, roads and parking lots, which slows accumulation and pulls the rain-snow line further inland than the official map suggests. Coastal influence works the other way, keeping temperatures marginal and turning what inland is a snowstorm into a rain event near the water.
What Do Snowfall Probability and Forecast Ranges Mean?
Forecast offices publish several different snow products, and most of the public confusion about percentages comes from mixing them up.
The percentage is not a coin flip
Probability of precipitation, written as PoP, is the chance that a given point in the forecast area sees measurable precipitation, where measurable usually means 0.01 inch. A 30 percent chance of snow does not mean it will snow 30 percent of the time at your house. It means forecasters are 30 percent confident that at least part of the area you were given will get measurable snow.
| Product | What it actually tells you |
|---|---|
| Probability of precipitation | Chance that a point in the area gets measurable precipitation, 0.01 inch or more |
| Quantitative precipitation forecast | Liquid water amount in inches for a period, before any snow ratio is applied |
| Chance of 2 inches or more | Probability that accumulation reaches a specific threshold, the product that answers “will it be enough to close school” |
| Storm total range | The most likely accumulation, usually given as a low to high band covering the central portion of the forecast |
How to read a range
A forecast of 3 to 5 inches means most plausible outcomes sit inside that band. A forecast of 1 to 7 inches is a much less useful statement, because it tells you the forecaster has very low confidence, and a plan built on the midpoint of that range could be off by more than the entire lower bound.
Scenario maps
When confidence is genuinely low, forecasters produce scenario maps showing the totals a tenth of the time, a quarter of the time, half the time and most of the time. Reading those percentile bands tells you which part of the range to actually plan around, which is usually better information than any single headline number.
How Far Ahead Snowfall Totals Can Be Forecast
Snow forecasts have real skill well beyond the two or three days most people assume, but the type of skill changes with lead time.
- Seven to ten days out: forecasters can often say whether an unusually cold or wet pattern will produce snow at all, but not where the heaviest axis falls.
- Three to five days out: storm track and precipitation type become reasonably reliable, and regional totals narrow into a workable range.
- One to two days out: snow level and amount are usually good, which is why this window drives winter weather warnings, closure decisions and travel planning.
- Under six hours out: radar nowcasting takes over and can locate heavy bands, though intensity remains uncertain.
The context matters here. A five-day forecast today is roughly as accurate as a one-day forecast was in 1980, so snowfall forecasting has genuinely improved even though individual storms still get busted. The frustration that shows up in weather forums, where people complain the same forecast keeps changing, has a mundane cause: forecasters are ingesting new data and rerunning the calculation, not guessing at random.
The habits worth keeping are simple. Read the threshold probability product, not just the headline range. Check the forecast discussion for the wording about ratio and storm type. Treat a wide range as a genuine warning that plans need flexibility, and remember that local terrain beats the grid far more often than the national maps admit.
Where forecasts most often go wrong
Error concentrates in a handful of predictable places, which is useful because it tells you when to distrust a number.
- Precipitation amount. Models are far less reliable at how much water falls than at whether it falls at all, and every tenth of an inch of error becomes a full inch of snow at a 10:1 ratio.
- Marginal temperatures. When the temperature profile sits within a couple of degrees of freezing, small errors flip the precipitation type entirely and move the rain-snow line by tens of miles.
- Track errors. A storm centre forecast 50 miles off shifts the heaviest accumulation axis with it, so one town gets the forecast total and its neighbour gets a fraction.
- Microphysics. Predicting the exact crystal type and therefore the snow ratio is harder than predicting where the storm goes.
- Local effects. Terrain, urban heat islands and lake-effect bands operate at a scale the model grid cannot resolve.
- Model resolution. A grid cell averages over several kilometres, so a sharp gradient is smoothed into something that is wrong everywhere inside it rather than wrong in one place.
Frequently Asked Questions
What is the most accurate snowfall model?
No single model wins every storm. The most accurate guidance is usually a blend of several runs, such as the GFS, the ECMWF and high-resolution regional models, statistically calibrated and then adjusted by a human forecaster. Historical scoring consistently shows that blend beating any individual model, especially within about 48 hours of the event.
How accurate are meteorologists’ snowfall predictions?
Accuracy depends on lead time and location. Within a day or two, storm type and general amounts are usually solid. Three to five days out, a forecast can reliably identify that a significant storm is coming but often miss the exact axis and total by several inches. Marginal events, where temperatures hover near freezing, are the hardest and most often underestimated.
What does a 20:1 snow ratio mean?
A 20:1 ratio means one inch of liquid water would produce about 20 inches of snow if it all fell as snow at that ratio. Such dry, light snow comes from very cold air and a deep cloud with high ice crystal growth. The same storm in warmer conditions could come out at 5:1, so the ratio is a critical assumption in every snow forecast.
How many inches of snow does it take to equal 1 inch of water?
It depends entirely on the snow. Typical ratios run from about 5 to 1 for wet heavy snow to 20 to 1 for dry powder, so one inch of liquid water equals roughly 5 inches of wet snow or 20 inches of powder. The general rule of thumb of ten inches of average snow to one inch of water is a reasonable starting point and nothing more.
How many inches of snow equals 3 inches of rain?
Using the same ratio logic, 3 inches of liquid water becomes about 15 inches of average snow at a 5:1 ratio, 30 inches at 10:1, and 45 to 60 inches in dry powder at 20:1 or higher. This is why forecasters publish liquid water equivalent alongside depth, and why the ratio assumption dominates any such conversion.
Why do different weather apps show different snow totals?
Each app displays the output of a different model or blend, and those models resolve snow slightly differently, particularly around the snow level and the snow ratio. Local elevation also differs from the model grid elevation, which can skew totals near hills. Comparing a few sources and trusting the official forecast office for your zone is more reliable than any single app.
If you read one thing in a winter forecast, read the probability of reaching a specific threshold rather than the headline total. It is the number that matches the decision you are actually making, whether that is a school closure, a flight or a road crew’s shift.