There is no single universal drought scale, and how drought is officially measured depends on the country or authority issuing the declaration. In the United States the reference product is the U.S. Drought Monitor, published weekly by the National Drought Mitigation Center, the U.S. Department of Agriculture and NOAA. It merges precipitation, soil moisture, streamflow, reservoir storage, snowpack and vegetation data with analyst judgment, then ranks each area against its own historical record and sorts it into one of five categories, from D0 abnormally dry to D4 exceptional drought.
Other countries use different thresholds and different names, and a monitoring classification is not the same thing as an emergency declaration that triggers watering bans or disaster aid. This guide walks through the data, the arithmetic and the human steps behind those numbers.
Table of Contents
- How Drought Is Officially Measured: Key Methods Explained
- Which Conditions Are Monitored to Detect Drought?
- What Data Do Scientists Use?
- How Is a Drought Index Calculated?
- Which Drought Measurement Systems Are Most Common?
- How Do Scientists Turn Data into Drought Categories?
- How Is Drought Severity and Duration Assessed?
- D0 abnormally dry
- D1 moderate drought
- D2 severe drought
- D3 extreme drought
- D4 exceptional drought
- How Does an Official Drought Declaration Work?
- What Are the Main Limitations of Measuring Drought?
- Frequently Asked Questions
- Does a drought exist whenever there is no rain?
- What is the difference between a drought and dry weather?
- Which official map should I use to check for drought?
- Is there one drought measurement system used worldwide?
- How long does it take for drought to be officially confirmed?
- What Should You Do First When Checking Drought Conditions?
How Drought Is Officially Measured: Key Methods Explained
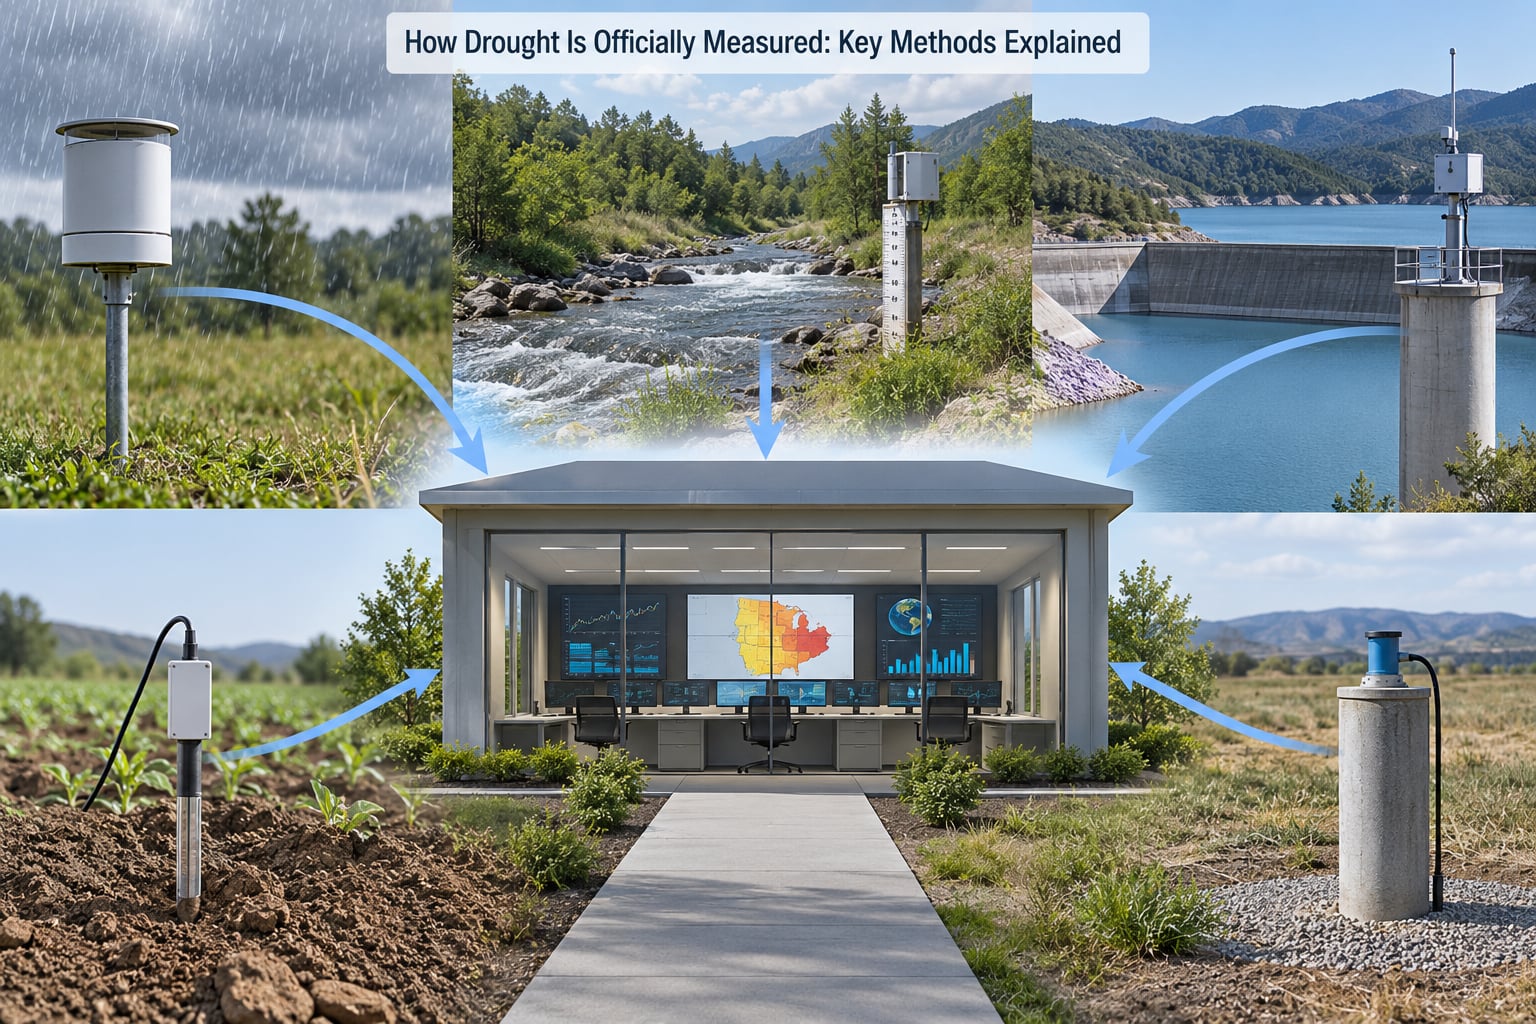
Official drought measurement follows four steps, in the same order in most national systems. Analysts assemble current and historical observations, convert them into comparable values such as anomalies or anomalies expressed as percentiles, compare each place against thresholds calibrated for its own climate, and then classify severity.
The comparison is always against the location’s own record rather than an absolute number. A dry month in a monsoon climate can be normal, while the same month in a temperate maritime climate can be the driest in a century.
Two different authorities are usually involved, and confusing them is the most common misunderstanding. A monitoring agency publishes the physical classification. A government body, often after reviewing water supply and sector impacts, decides whether to act on it.
Internationally, the World Meteorological Organization recommends the Standardized Precipitation Index as a common reference, which is why that index shows up in national reporting well beyond the United States. It is a recommendation rather than a mandate, and most countries still publish their own official map.
Which Conditions Are Monitored to Detect Drought?
Drought is a persistent departure from normal water supply conditions for a region, not simply a stretch of time without rain. A single dry week is weather. Weeks of shortfall that leave farms, rivers and reservoirs below their usual levels are drought.
Each monitored variable answers a different question, and the questions sit at different points in the water cycle.
- Precipitation tells you whether water is arriving faster than it leaves.
- Soil moisture tells you how much water is available to plants right now.
- Streamflow tells you how much water is moving through rivers and watersheds.
- Reservoir storage tells you how much water is being held for later use.
- Groundwater levels tell you about aquifers that supply wells and baseflow.
- Snowpack and snow water equivalent tell you how much water is stored as snow in winter.
- Vegetation condition, often derived from satellite greenness data, tells you about crop and range stress.
- Temperature and evaporative demand tell you how quickly water is leaving the system.
Because these variables respond at different speeds, a wet month can coexist with drought at another time scale. October can be the wettest month of the year in a region that spent the summer in D4 exceptional drought, and the Drought Monitor still shows that summer’s deficit because reservoirs and groundwater have not refilled yet.
Timing matters as much as totals. The same monthly rainfall total delivered in a few intense storms produces a different outcome from the same total spread evenly, because heavy rain runs off rather than soaking in.
What Data Do Scientists Use?
Official systems rarely rely on one feed. The table below shows the main observed and modelled inputs, and why each one is included despite its limitations.
| Input | Typical source | Window | Strength | Limitation |
|---|---|---|---|---|
| Precipitation | Gauge stations, radar, satellite | Weekly to 12 months | Direct measure of water arriving | Convective rain is hard to measure accurately |
| Soil moisture | Satellite retrieval, modelled | Weekly to 6 months | Shows what crops and surface use | Coarse resolution; depth is modelled, not observed |
| Streamflow | Stream gauges, modelled runoff | Weekly to 24 months | Reflects whole-basin supply | Gauges are sparse and often in regulated reaches |
| Reservoir storage | Agency reporting | Weekly to 12 months | Direct measure of stored water | Rules and imports can mask the underlying balance |
| Groundwater levels | Observation wells | 3 to 24 months | Captures slow aquifers and baseflow | Very sparse network, long lag after recharge |
| Snow water equivalent | Snow surveys, remote sensing | Winter accumulation and melt | Forecasts next season’s runoff | Warm rain and early melt break the relationship |
| Vegetation stress | Satellite greenness indices | 1 to 8 months | Directly observes crop impact | Confused by irrigation, fire, pests and planting cycles |
| Temperature and potential evapotranspiration | Station and gridded data | 1 to 12 months | Catches flash drought from heat alone | Evapotranspiration is a model estimate |
Each input feeds one or more indices, and none of them is used on its own. Analysts also watch where the inputs disagree, because a watershed with normal rainfall and falling streamflow is telling you something the rainfall record alone cannot.
Observations are quality controlled before they are used. Automated screening flags impossible values, a human analyst checks them, and any correction is logged so the published map is reproducible.
How Is a Drought Index Calculated?
Every drought index follows the same three-step logic, even when the variables differ. First the observed value is compared with the historical record for that place and time of year to produce an anomaly. Second the anomaly is converted into a comparable figure, usually a standardized value or a percentile. Third that figure is matched against thresholds that define each severity class.
The percentile step is the part most readers find confusing, so here is how it works. A percentile answers a simple question: in how many years since the record began was it drier at this time of year than it is now? If the answer is 4, the location is in the driest 4 percent of its own history, so it sits in the 1st to 2nd percentile band rather than in the middle of the distribution.
Worked example: a county receives 35 percent of its normal rainfall over a 12-month window. Its total falls at the 4th percentile of the county’s record for that window. A 4th percentile lands in the 3rd to 5th percentile band used for D3 extreme drought, so the area is mapped as D3 even though nothing about the number looked alarming on its own.
Standardized indices such as the Standardized Precipitation Index use a related approach. They convert an anomaly into units of standard deviation, and a value near zero means conditions close to the historical median for that calendar window.
Both approaches have the same weakness. They assume the historical record is a reasonable description of the future, which becomes questionable as the climate shifts and old data stops being a fair baseline.
Which Drought Measurement Systems Are Most Common?
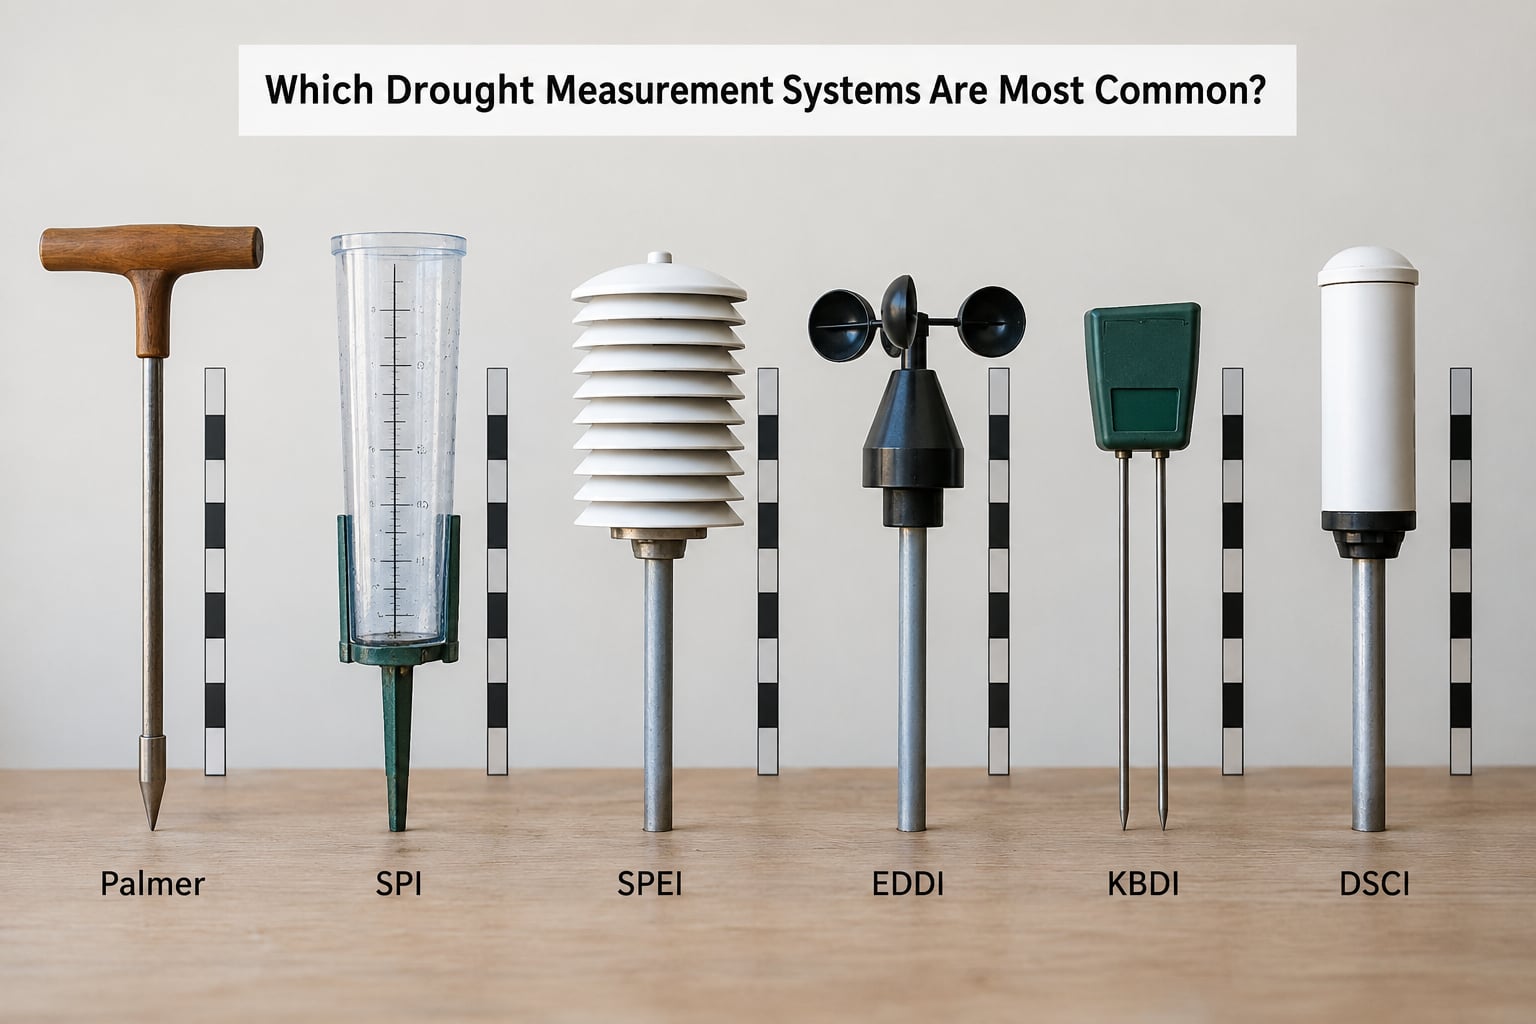
Several systems are in regular use, and they answer different questions. The table compares the ones most readers will encounter, including timescale and numeric range.
| System | What it measures | Timescale | Range | Best used for |
|---|---|---|---|---|
| U.S. Drought Monitor | Combined indicators plus analyst judgment | Current week to several years | D0 to D4 | The official U.S. picture and all downstream policy |
| Palmer Drought Severity Index | Water balance from precipitation and temperature | Months to decades | About -4 to +4 | Long-term trends and agricultural moisture |
| Standardized Precipitation Index | Precipitation alone, standardized | 1 to 48 months | Around -3 to +3 | Comparing regions and filling gaps |
| Standardized Precipitation Evapotranspiration Index | Precipitation minus evaporative demand | 1 to 48 months | Around -3 to +3 | Drought shaped by heat as well as rainfall |
| Evaporative Demand Drought Index | Evaporative demand and soil moisture | Daily to 12 months | Open-ended index | Flash drought and wildfire fuel dryness |
| Keetch-Byram Drought Index | Topsoil and lower soil moisture | Weekly, cumulative | 0 to above 700 | Fire danger and burn restrictions |
| Drought Severity and Coverage Index | Area-weighted severity across a region | Weekly | 0 to 4 | A single national headline number |
| Vegetation Health Index | Satellite greenness against its own history | 1 to 8 months | 0 to 100 | Crop and range stress |
| European Drought Observatory | Observed and modelled indicators across Europe | Weekly to 3 months | Classes and index values | Pan-European reporting and early warning |
| National Integrated Drought Information System | Portal assembling indicators and impacts | Continuous | Not a single scale | Finding official data for a U.S. county |
None of these is universally official. Official status attaches to the product a government designates, and that varies by country and by the purpose of the declaration.
In the United Kingdom, for example, drought status is assessed by the Environment Agency with other agencies and reported through the National Water Resources Drought Group, using England drought status levels that run from normal through to emergency. That is a different scheme with different names, and it is not interchangeable with the U.S. categories.
How Do Scientists Turn Data into Drought Categories?
Classification approaches fall into four families, and most real systems mix them.
A percentile approach ranks each location against its own historical record and assigns classes by cutoff. The U.S. Drought Monitor uses percentile bands for its five categories, which is why two neighbouring counties can land in different classes when they sit close to a cutoff.
A probability approach estimates how likely a comparable or worse condition is, which is common in water supply planning and in forecast-based early warning.
A threshold approach simply marks a point where an effect begins. Soil moisture below a set value, or reservoir storage under 30 percent of capacity, is a threshold, and it is blunt but easy to explain.
A composite approach blends several inputs into one picture, either by averaging standardized values or by letting analysts apply judgment directly when the numbers and the ground truth disagree.
Saying an area is in the driest 10 percent of its record is a statistical statement. Declaring a drought emergency is an administrative act that considers water supply, sector impacts, duration and forecast outlook. Only the second one changes what a city is allowed to do with its water.
How Is Drought Severity and Duration Assessed?
Severity and duration are graded separately, and category names shift between systems even when the underlying idea matches. The levels below follow the widely used D0 to D4 convention.
D0 abnormally dry
This is the entry level of the scale and is not technically drought. It usually marks a short-term dryness such as a low snowpack or a dry spring, and it signals that later stages are more likely if conditions do not improve.
D1 moderate drought
Some fields show water stress and crops lose yield. Grass fires become more likely where the fire risk index is also elevated, and reservoirs in low-rainfall basins begin to draw down faster than usual.
D2 severe drought
Pasture and hay crops fail, soil moisture in the root zone runs short, and irrigation efficiency becomes a matter of survival for some growers. Streams in the region drop well below their normal flow, and reservoir storage begins to matter for water supply planning.
D3 extreme drought
Crop failure becomes widespread, groundwater levels decline, and small streams stop flowing. Hydropower output falls, water tables under wetlands drop, and emergency water management begins in earnest.
D4 exceptional drought
Water supply becomes the binding constraint. Groundwater is dewatered, reservoirs fall to historic lows, hydropower generation can stop, and irrigation allocations fall sharply. This is the level at which the economic damage is measured in billions.
Duration runs on separate clocks. Meteorological drought can start within weeks, agricultural drought tends to follow weeks to months later, and hydrological drought can persist for years because aquifers and reservoirs respond slowly.
That lag is why recovery is also slow. Rain has to refill soil, then streams, then reservoirs, then groundwater, and only then do restrictions ease. A single storm rarely ends a hydrological drought, which is why residents in the United Kingdom and other countries report that exiting drought status can take many months of steady rain.
How Does an Official Drought Declaration Work?
A published monitoring classification follows a routine sequence, and for the U.S. Drought Monitor the timing is fixed and public.
- Data collection closes on Tuesday, the valid date of every map published that week.
- Analysts pull precipitation, soil moisture, streamflow, reservoir, snowpack, vegetation and temperature data, then compute each indicator.
- Each location is ranked against its own historical record and converted into percentile values.
- The author of the week converts those values into draft categories and writes the narrative discussion.
- A second analyst reviews the draft independently, and disagreements are reconciled between them.
- The final map and report are published on Thursday, with the valid date clearly stated.
- The rotating author role moves between the partner agencies, which is why the byline changes week to week.
That entire sequence is retrospective. It describes conditions that already existed on Tuesday and never issues a forecast for the following week.
An administrative declaration is separate and slower. It normally follows a request or a formal assessment, requires sign-off at political or emergency-management level, and can unlock water restrictions, agricultural aid, federal disaster assistance or insurance eligibility. The monitoring map is the evidence; the declaration is the decision.
Restrictions also run in one direction only. Watering bans are a response to drought, and they never feed back into the classification of the following week.
What Are the Main Limitations of Measuring Drought?
Every method trades accuracy somewhere. Knowing where the seams are helps more than treating one number as the whole story.
Gauge networks are unevenly spaced, and in remote basins a station can be hundreds of kilometres from the area it is meant to represent. Satellite retrievals give full coverage but estimate soil moisture from microwave signals that are affected by vegetation, roughness and surface temperature, so their error is real and sometimes large.
Historical baselines are shifting. An index calibrated against twentieth-century records will eventually describe a climate that no longer exists, and a re-baselined index is not directly comparable with the old series.
Human systems muddy the picture further. Irrigation returns water to the soil in a way rain never does, so an intensively farmed valley can look healthy on satellite data while its aquifer falls. Urban heat islands raise local evaporative demand that a regional average hides. Reservoir operating rules decide how much water is released, which can look like supply without being supply.
Snow is a good example of the mismatch. A near-normal snowpack can still produce below-normal runoff if warm storms bring rain instead of snow, or if a dry spring melts the pack earlier than usual.
Finally, forecasts carry genuine uncertainty, and the lag between a meteorological drought and a hydrological one means that conditions can keep worsening after the rain returns.
The practical answer is to compare several indicators rather than trusting one. When the soil moisture, the streamflow and the precipitation percentile all point the same way, the classification is reliable. When they disagree, the disagreement is itself the information.
Frequently Asked Questions
Does a drought exist whenever there is no rain?
No. A dry spell on its own is weather, and many dry climates go months without rain by design. Official systems require a persistent departure from normal water supply, which is why indices are calculated over windows of weeks, months or years rather than days. Even a completely rainless month can leave a region classified as normal if the surrounding months were wet and reservoirs are still full.
What is the difference between a drought and dry weather?
Dry weather is a short atmospheric state: a few sunny, rainless days. Drought is a sustained water supply deficit that shows up in soil, streams, reservoirs or aquifers. Because different parts of the water system respond at different speeds, the two can overlap or disagree. A rainy week does not end a hydrological drought, and a dry week does not rule one out.
Which official map should I use to check for drought?
Use the map published by your national water or meteorological authority. In the United States that is the U.S. Drought Monitor, updated weekly on Thursday with data valid on the previous Tuesday. Elsewhere, look for your national drought observatory or water agency, and check that the map carries a publication date and a valid date, because an undated map tells you nothing about how current it is.
Is there one drought measurement system used worldwide?
No single system is mandatory worldwide, though the World Meteorological Organization recommends the Standardized Precipitation Index as a common reference. Countries publish their own official products, and thresholds, category names and time windows differ between them. When comparing figures across borders, check what each system measures and over what period, because the same name can cover different methods.
How long does it take for drought to be officially confirmed?
A monitoring classification appears on the weekly cycle, so conditions meeting the thresholds can be reflected within days. An administrative or emergency declaration takes much longer, because it requires an impact assessment, review and political sign-off. Recovery is slower still: soil refills first, then streams, reservoirs and groundwater, which is why a hydrological drought can persist long after meaningful rain returns.
What Should You Do First When Checking Drought Conditions?
Start with the most recent map published by your national authority and read the valid date before anything else. An old map is worse than no map, because conditions change weekly.
Then pick the timescale that matches your question. Short windows explain current crop stress and fire danger, while long windows explain reservoir and aquifer behaviour, and a location can look fine on one and serious on another.
Compare at least three indicator families: precipitation against local normals, soil moisture, and streamflow or reservoir storage. When they agree, you have a reliable picture. When they conflict, the conflict points to the lag between the start of a drought and its arrival in the water supply system.
If you are already subject to watering limits or a fire restriction, that is an administrative decision made on official information. Follow the notices from your water and disaster agencies rather than trying to read the map yourself.