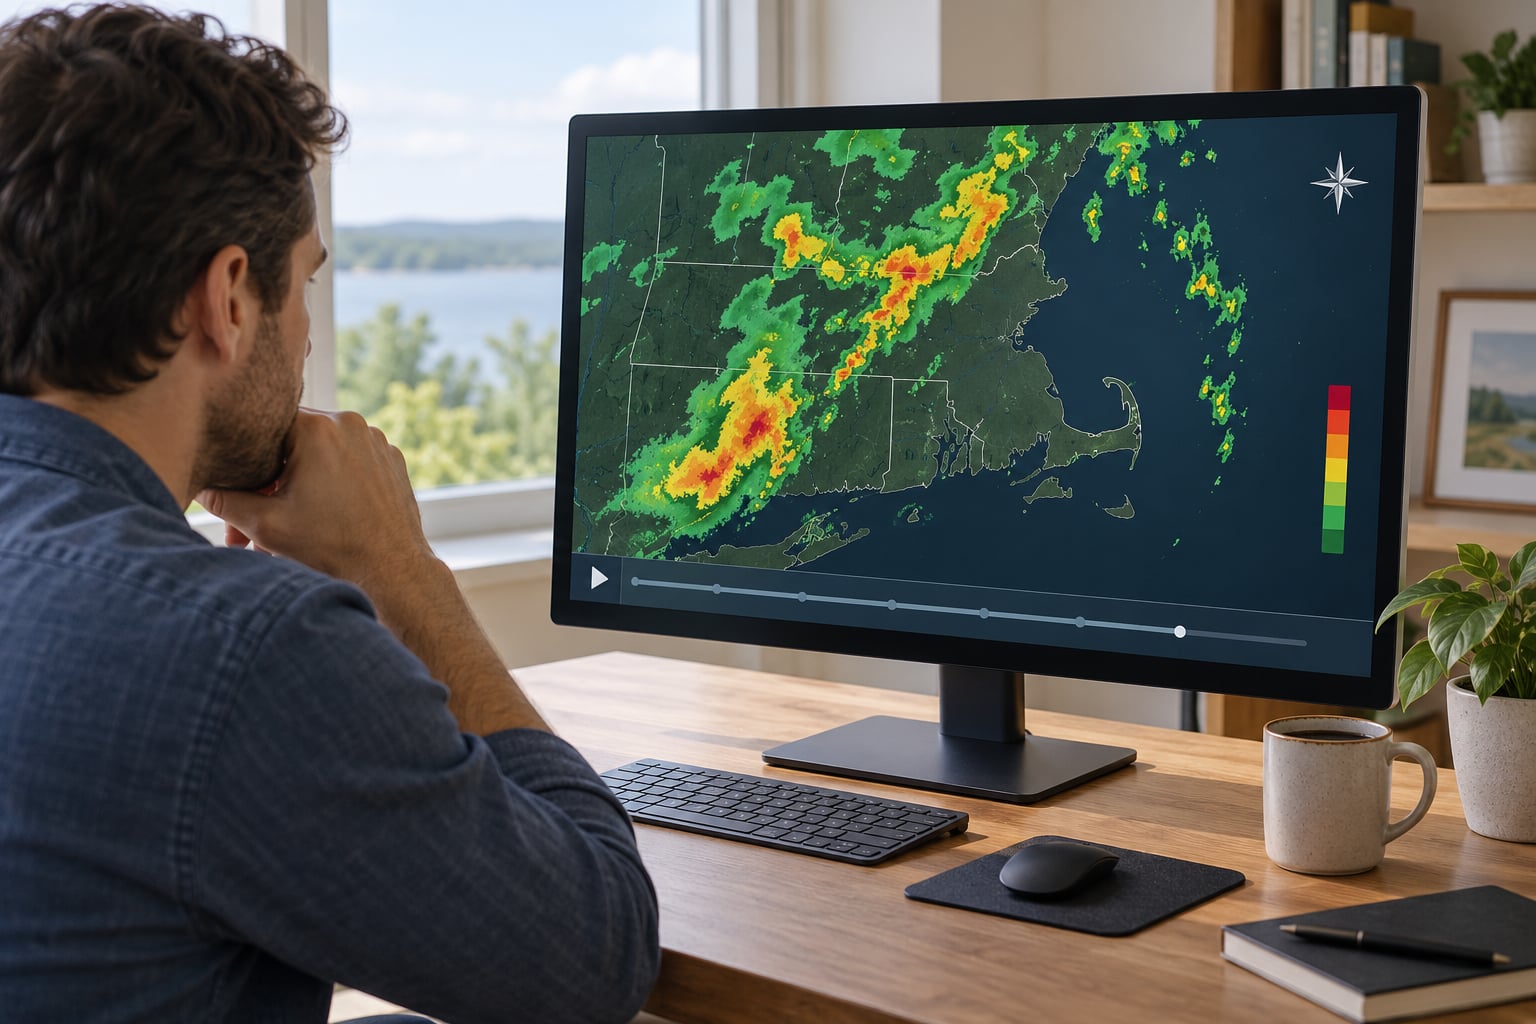
Learning how to read a weather radar map takes about ten minutes, and the core skill is just three things: knowing what the colors mean, watching how the echoes move between frames, and checking the official warnings before you act. Radar is a snapshot of the sky sampled by a beam that passes above your head, which is why it never tells the whole story on its own. Used the way forecasters use it, it turns a colored blob into an answer to a practical question: when does this reach me, and how bad will it be when it does?
I have watched people make the same three mistakes for years: treating dark red as a tornado, treating the biggest dBZ number as the strongest wind, and reading a two-minute-old loop frame as if it were happening now. None of those are hard to unlearn once you know what the display is really measuring.
This guide is written for anyone who plans around weather and has never had a meteorology class: commuters, travelers, parents, outdoor workers, boaters, golfers, and people running small events who need a yes-or-no answer in under a minute. Radar products are supplied by the National Weather Service (NWS) in the United States and by national weather agencies elsewhere, so the same principles apply in most countries with different colors or terminology. Last reviewed October 2026.
Table of Contents
- What You Need
- Step-by-Step: How to Read a Weather Radar Map
- Step 1: Confirm the Radar Location and Coverage Area
- Step 2: Check the Time, Loop, and Update Status
- Step 3: Understand the Radar Colors
- Step 4: Read the Movement and Direction of Storms
- Step 5: Look for Severe Weather Signs
- Step 6: Match Radar Information with Official Weather Alerts
- Common Mistakes
- Frequently Asked Questions
- What does each color mean on the weather radar?
- How does weather radar work?
- Does red and green on the radar mean a tornado?
- Why does radar show rain when it is not raining near me?
- How far away does weather radar detect storms?
- Which weather radar app is the most accurate?
- Conclusion
What You Need
Before you interpret anything, put five things within reach. Miss one of them and your reading will be wrong in a way that feels convincing.
- A radar map. The NWS public radar viewer is free and needs no account. RadarScope, Windy, MyRadar, and most national weather services have their own apps. All of them draw from the same underlying radar network, so they mostly differ in layer access and default settings rather than accuracy.
- Your location, and the location of whatever you care about. Set the map to center on your exact spot, not on a city you are 40 miles from. Then drop a marker on the destination if it is not where you stand.
- The timestamp. Every radar frame carries the time it was observed. If the app shows 14 minutes old, you are reading history.
- The legend. The color scale is printed on the map, usually along the bottom or in a corner panel. Radar communities are strict about this: check the legend before interpreting any image, because scales differ between apps, products, and countries.
- Official weather alerts. Watches, warnings, and advisories come from the NWS or your national weather service. Radar is a picture of the atmosphere. Alerts are the official decision about what you should do.
Radar is one piece of a bigger set. The two-minute overview matters, because beginners often arrive from a weather app expecting a satellite image, or expect radar to tell them the temperature. Neither is what it does.
Step-by-Step: How to Read a Weather Radar Map
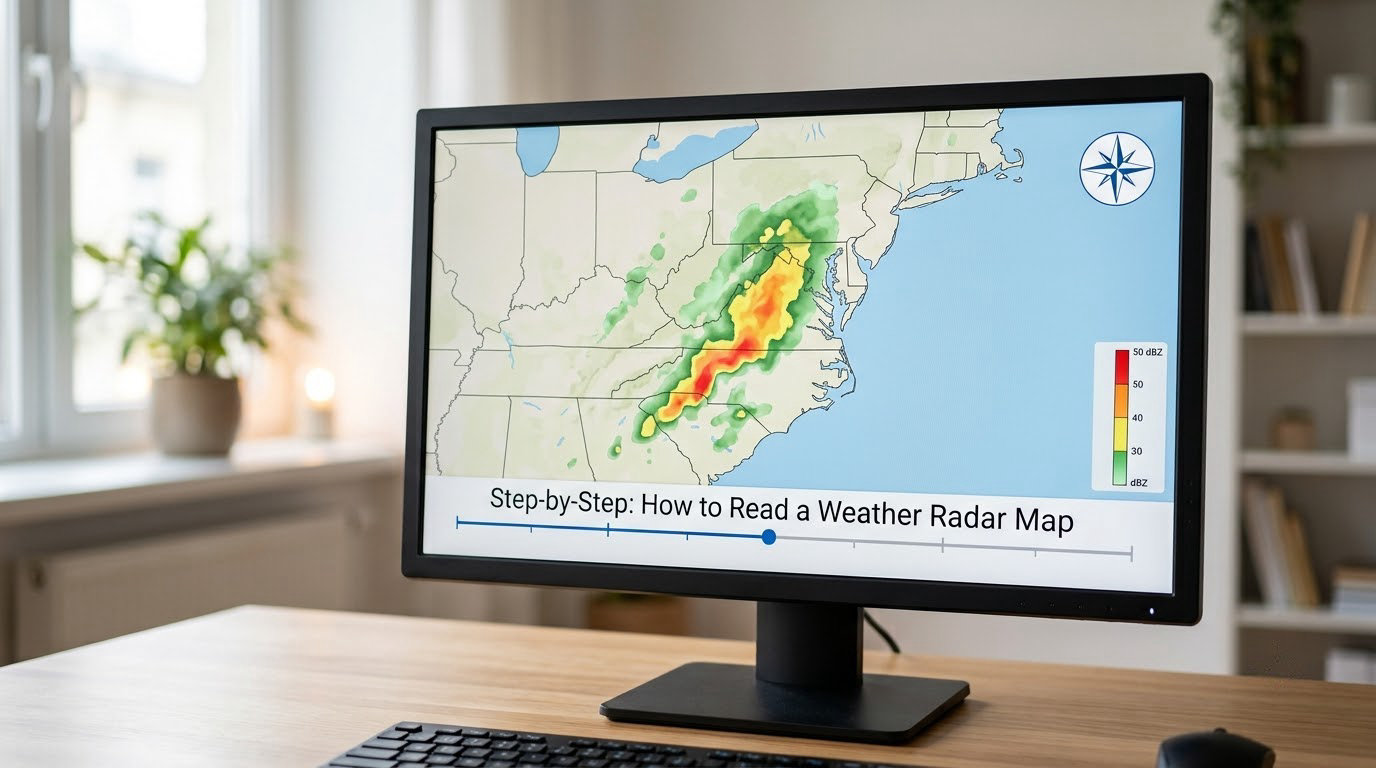
Step 1: Confirm the Radar Location and Coverage Area
Every radar map is drawn from one or more fixed radar sites, and the most useful radar is usually the nearest one. Look for the site name and the beam center on the display, then check how far your location sits from it.
Distance matters more than beginners expect because the beam climbs as it travels. Roughly speaking, the beam is about 1,000 feet above the ground close to the radar and well over 10,000 feet high about 100 miles out. That means a storm 80 miles away is being sampled several miles above your neighborhood, and a storm with a tall updraft can hide the most dangerous part of itself from the lowest tilt.
How you tell it worked: you can see the site name, the range rings or distance markers, and your marker positioned inside the area the radar actually covers. If your position is beyond the outermost ring or the map will not zoom to your area, switch to the neighboring site. Many apps handle this automatically and blend several radars into a mosaic, which is more reliable for long-distance looks but blurs fine detail near the ground.
Step 2: Check the Time, Loop, and Update Status
Find the timestamp on the frame and check it against the current time. Radar volumes take several minutes to complete and process, so a displayed age of 5 to 15 minutes is normal even on a good connection. Anything beyond about 20 minutes means the site is lagging or your app is not refreshing.
Then look at the animation loop. This is where a lot of readers go wrong, so here is the tell that experienced users rely on: observed frames carry a timestamp for when the radar measured them, while a future-radar or nowcast frame is a computer extrapolation that has not been measured yet. If your loop is mixing the two, which many apps do, you can be looking at projected weather and believing it already happened.
How you tell it worked: you can name the age of the newest frame out loud, and you know whether the loop contains only observations. The loop bar itself is the key. If the last frame is labeled a future time, ignore it for decision-making and use the newest observed frame only.
Step 3: Understand the Radar Colors
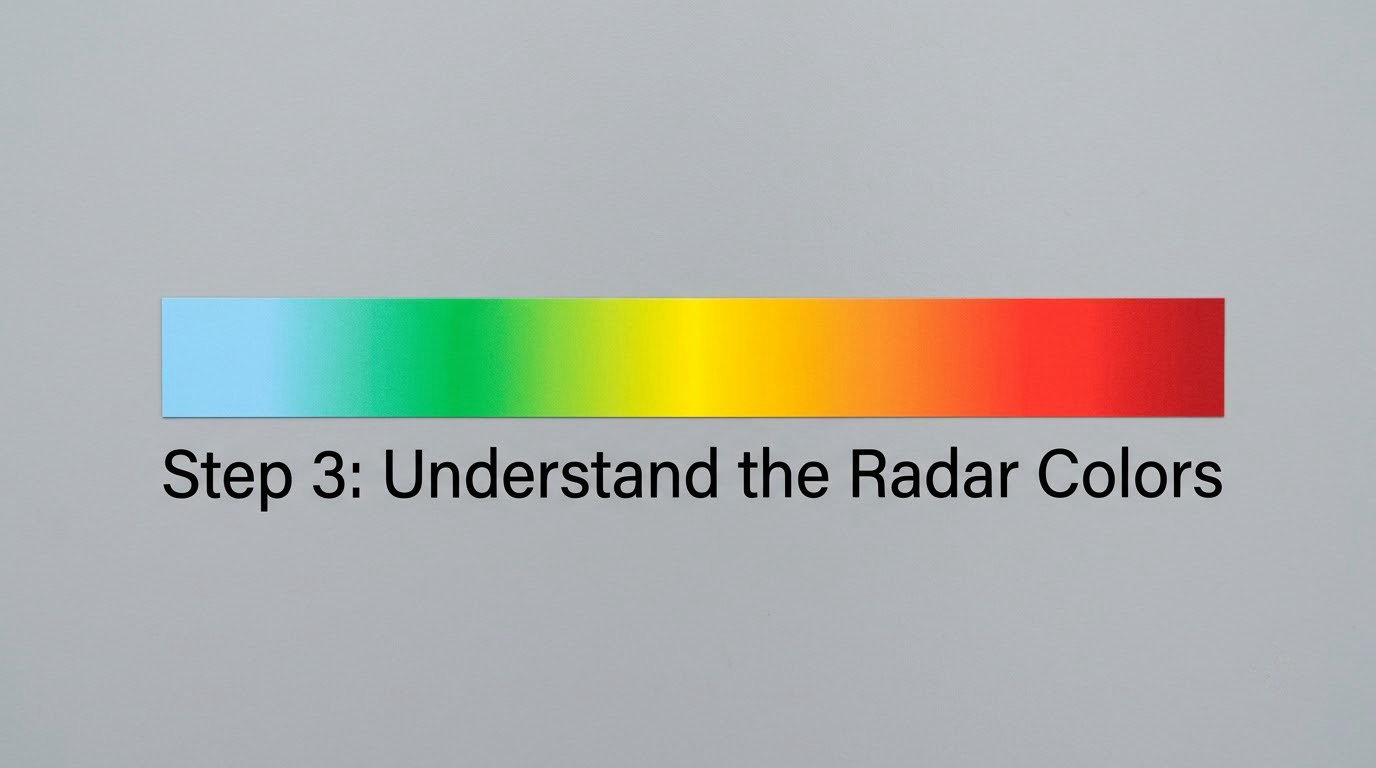
Colors encode reflectivity, which is a measure of how much energy rain, snow, or hail sent back to the radar. It is expressed in dBZ, decibels relative to the reflectivity factor Z, on a logarithmic scale. Here is the practical part: 10 dBZ is not ten times as much rain as 0 dBZ, and the scale is not a rainfall total. A jump from 20 to 40 dBZ is a large change in the returned signal, not a doubling of water on your lawn.
The color names below are the standard NWS-style scale, and most US apps inherit them. Other countries use different thresholds, so read the legend on your own screen rather than memorizing these numbers.
- Gray or transparent. No meaningful return, or nothing the radar can detect. Clear air returns almost nothing, which is why a sunny sky shows an empty map.
- Light blue to blue. Very light rain, drizzle, or fine snow. Below roughly 5 to 10 dBZ most people would not call it rain at all.
- Green. Light to moderate rain, falling steadily. This is the color of a normal shower, and of rain that rarely stops an outdoor event on its own.
- Yellow. Moderate to heavy rain, the point where water pools on roads and visibility starts dropping in a downpour.
- Orange. Very heavy rain, or a mix of rain and something denser. Slow roads, standing water, and a real chance of a commute problem.
- Red. Intense precipitation cores, or hail mixed in. It signals a strong updraft region. It does not, on its own, mean a tornado.
- Magenta, purple, or white. The highest reflectivity values, generally 65 dBZ and above. This is almost always a hail core or a very intense thunderstorm, though the scale can also pick up non-meteorological objects.
For rough planning, US forecasters associate values near 20 dBZ with light rain, around 40 dBZ with heavy rain, and 55 to 65 dBZ with thunderstorms that carry hail. Treat those as guidance, not measurement, because hail, insects, and even a flock of birds can push a cell into the top colors.
One more label to know: you will often see both base reflectivity and composite reflectivity. Base reflectivity uses only the lowest scan tilt, so it is the truest picture of what is falling closest to the ground. Composite reflectivity scans multiple angles and takes the highest value at each point, which is why it can show a bright core high in a storm that base reflectivity barely registers. For storm structure, hail, and rotation, base is the product to read.
How you tell it worked: you can point to a color, name the intensity it represents, and say that it is a reflectivity reading rather than an amount of rain or a wind speed. If you cannot do the third part, you are reading the map by feel instead of by meaning.
Step 4: Read the Movement and Direction of Storms
Colors tell you how strong the precipitation is. The animation tells you where it is going, and that is usually the question you actually have.
Start the loop and watch the leading edge of the echo, not the whole blob. Storms usually move in a steady direction that matches the winds aloft, and in the mid-latitudes that is often west to east, though right-moving storms are common in the warm sector of a developing system. The trailing stratiform rain behind a line can drag the eye backward, so follow the sharp edge instead.
To estimate arrival time, use the frames like this. Note where the leading edge sits at the timestamp of the oldest frame, then where it sits at the newest. Count the minutes elapsed between those two frames. That distance covered in that number of minutes is your speed, so you can divide the remaining distance to your location by it and get a rough arrival time. If the edge advances noticeably faster in the later frames, the storm is accelerating and your original estimate is too long.
A worked example makes the arithmetic less abstract. Say the leading edge is 20 miles west of your house on the 15:10 frame, and it is 12 miles west on the 15:20 frame. That is 8 miles in 10 minutes, so roughly 48 miles per hour. Dividing the remaining 12 miles by that pace gives about 15 minutes, which puts arrival near 15:35. Now check the previous frame pair: if the cell covered only 4 miles in those same 10 minutes, the storm is speeding up and you should move your estimate earlier rather than trust the slower pace.
One more caution on the loop. Many apps include a future-radar frame that extrapolates the last observed frames forward, and it looks identical to a real one. Projection is a reasonable guess for a steady, well-behaved line, and a poor one for a storm that is growing, merging, or turning, which is exactly the case where you need accuracy.
How you tell it worked: you can point at the storm, name the direction it is traveling, and give an arrival window rather than a single confident minute. Anyone who gives you an exact arrival time from a radar loop is guessing with extra steps.
Step 5: Look for Severe Weather Signs
Reflectivity alone will not tell you about rotation, because rotation and heavy rain are different measurements. Switch the product to velocity or storm-relative velocity, which color the wind by whether it is moving toward the radar or away from it. Reds and greens sit side by side in ordinary straight-line wind too, so a color pair by itself means nothing.
What matters is a tight couplet of red and green sitting right next to each other, on the same side of a storm, persisting across several frames, with a tight inbound-outbound gradient. That pattern is the signature forecasters look for when checking a supercell. Even then, a couplet is not proof of a tornado, and beam height can manufacture or hide one. The general rule from experienced spotters is that a couplet alone is not a tornado; context, spacing, persistence, and beam height all have to line up.
On the reflectivity side, watch for shapes:
- A hook or appendage on the flank of a storm, which can indicate a rotating updraft.
- A bowed or curved line, a shape associated with a well-organized squall line that can carry damaging straight-line wind, sometimes called a derecho.
- A discrete cell that is growing taller rather than wider, and has a hard red or magenta core on the inflow side.
- A debris signature, visible on dual-polarization products as a column of lower correlation values inside the storm. It suggests lofted debris and often leads forecasters to issue a tornado warning, but it is not proof either.
- A cell that keeps reorganizing over the same spot, which suggests it is being fed and anchored rather than drifting through.
How you tell it worked: you switched products, you are looking at a persistent couplet or a growing core rather than a single frame, and you know radar cannot confirm a tornado on its own.
Step 6: Match Radar Information with Official Weather Alerts
Finish by checking the alert layer, which most apps pull from the national weather service. Radar tells you what is in the atmosphere. The alert tells you what the responsible agency has decided, and that decision is what should drive your behavior. If a tornado warning covers your area, you act on the warning, not on your own reading of the pixels.
Beginners also confuse radar with two other things that appear in the same app, and the mix-up causes most of the weird questions:
- Radar shows only precipitation, from a beam that samples above the ground. It is precise, current, and blind to clear-air conditions, cloud type, and temperature.
- Satellite shows cloud tops across a huge area, useful for watching an entire weather system approach days out. It cannot tell you rain intensity at street level, and it lags behind what is actually falling.
- Surface observations and forecast maps show measured temperature, wind, pressure, fronts, and station data, plus the forecast reasoning. They are the right tool for planning hours ahead, not minutes ahead.
How you tell it worked: you have the radar picture, the alert status, and a forecast for later, each used for what it is actually good at.
Common Mistakes
Reading dBZ as a rainfall total. The scale measures returned energy on a logarithmic curve, not inches of rain. A red cell is not a fixed amount of water; it is a signal strength that can come from heavy rain, melting hail, or a mix. Fix: use reflectivity for intensity ranking, and check gauges and warnings for actual amounts.
Believing red and green together means a tornado. That color pair is how velocity displays show wind blowing toward and away from the radar, which happens in every thunderstorm. Fix: look for a tight, adjacent, persistent couplet, and treat it as a reason to check the warning, not as a diagnosis.
Thinking a high dBZ number means strong wind. A 60 dBZ core tells you about a dense precipitation core, usually hail or very heavy rain. Wind speed comes from the velocity product. Fix: never estimate wind speed from reflectivity colors.
Ignoring the timestamp. A loop frame from twenty minutes ago is a memory, and convective storms move fast enough that the situation at your house can already be different. Fix: check the age of the newest frame before you interpret anything.
Reading a future-radar frame as observed weather. Nowcast frames blend real observations with computer extrapolation, and some apps place them in the same loop. Fix: confirm whether the loop contains only observed frames before you base a decision on it.
Wondering why the map shows rain and nothing is falling. This is often virga, where precipitation evaporates or is absorbed before reaching the ground. Beam height causes it too, since the lowest scan is still far above the surface at long range. Fix: use radar for trend and location, and check a surface observation or a nearby observation site for what is actually happening at the ground.
Treating radar as an alert system. Radar does not issue warnings, and forecasters issue warnings based on radar plus reports, lightning data, storm environment, and damage reports. Fix: read the alert layer, and follow official instructions when a warning covers you.
Two more habits that pay off quickly. First, learn where the layer menu is in your app, because the default product is almost always reflectivity, and velocity and dual-polarization products are usually hidden one menu down. Radar enthusiasts on forums and in the RadarScope community say the same thing over and over: beginners never find the layer menu, so they never see the product that actually shows rotation. Second, when a storm looks threatening, decide on your response in advance, because the useful decisions get made before the radar looks scary, not after.
Frequently Asked Questions
What does each color mean on the weather radar?
Colors show reflectivity, meaning how much energy rain, snow, or hail returned to the radar, measured in dBZ. Light blue and blue mean very light precipitation, green is light to moderate rain, yellow is moderate to heavy, orange is very heavy, red is an intense core often with hail, and magenta, purple, or white marks the highest values near 65 dBZ and above. Color shows intensity, not an exact rainfall total, so read the legend printed on your own map.
How does weather radar work?
A radar site sends out microwave pulses and listens for the small share of energy scattered back by precipitation particles. That returned power is converted into a reflectivity factor, shown as dBZ on a logarithmic color scale, and phase differences between pulses give radial velocity, the speed at which targets move toward or away from the radar. Because the beam points upward, radar samples the atmosphere above the ground rather than the ground itself.
Does red and green on the radar mean a tornado?
No. On a velocity display, red and green simply show wind moving away from and toward the radar, and every thunderstorm produces that pairing. A meaningful rotation signal is a tight couplet of red and green directly adjacent, on the same flank of a storm, persisting across several frames, with a sharp inbound-outbound gradient. Even then a couplet is not proof, and beam height can hide or exaggerate it, so confirm with official warnings.
Why does radar show rain when it is not raining near me?
Two common reasons. Virga happens when precipitation evaporates or is absorbed before it reaches the ground, so a weak echo can sit above a dry surface. Beam height is the other: the beam climbs with distance, so a storm far away is sampled miles above your location, and a tall storm can show an intense core that is not reaching the ground at all. A surface observation nearby is the fastest way to check what is actually falling.
How far away does weather radar detect storms?
A typical operational radar covers well over a hundred miles, but useful detail declines with distance because the beam rises as it travels. Close to the site the lowest scan sits about a thousand feet above the ground, while near the edge of coverage it is far higher, which means small features near the surface go unseen. For storms far away, a mosaic of several sites or a velocity product gives a better read than a single low tilt.
Which weather radar app is the most accurate?
Most apps, including RadarScope, Windy, MyRadar, and the free public NWS viewer, pull from the same national radar network, so the underlying data is the same. What differs is which products you can reach and the default settings. Apps that hide velocity, storm-relative velocity, and dual-polarization layers force you to read reflectivity only, which is why expert users care more about layer access than about brand.
Conclusion
Learning how to read a weather radar map comes down to a repeatable sequence, and it takes under a minute once it is a habit. Center the map on your exact location and check which radar site covers you. Confirm how old the newest frame is, and that the loop contains only observations. Read the legend so the colors mean something specific to that display. Follow the leading edge across several frames to get a direction and an arrival window. Switch to velocity and look for a tight, persistent couplet rather than a scary color. Then check the official alerts, and let those decide what you do.
Keep the caveat close. Radar samples the atmosphere above the ground, it lags real time by minutes, and it cannot confirm a tornado, a wind speed, or an exact rainfall total on its own. It is still the best public picture of where precipitation is right now and where it is heading, and once you know which product answers which question, it stops being a pretty picture and starts being a tool.