
Here is the short version: unemployment numbers are measured two ways. The Bureau of Labor Statistics runs a monthly survey of about 60,000 households and asks each person what they were doing during a specific week, then sorts everyone into employed, unemployed, or outside the labor force. The headline rate is the number counted as unemployed divided by everyone counted as either employed or unemployed.
That definition is strict on purpose, and strictness is where most of the confusion comes from. Once you see exactly who falls inside the denominator, the number stops looking mysterious.
Table of Contents
- What Does the Unemployment Rate Measure?
- Who Counts as Employed, Unemployed, or Outside the Labor Force?
- How Does a Household Survey Measure Unemployment?
- What Does Payroll Data Show?
- How Unemployment Numbers Are Measured Across the Two Main Sources
- How Is the Unemployment Rate Calculated?
- Why Are Unemployment Figures Revised?
- What Is Seasonal Adjustment?
- Which Unemployment Rate Should You Use?
- How Do Unemployment Rates Change Across Countries?
- What Are the Limitations of Unemployment Statistics?
- Frequently Asked Questions
- Is the unemployment rate the percentage of all adults without a job?
- Why can the unemployment rate fall even when few people find work?
- Why does the unemployment rate sometimes change after it is first published?
- Are people working part time counted as employed?
- Why does a country’s unemployment rate differ from another’s?
- Does a low unemployment rate mean the economy is healthy for everyone?
- What to Look at First
What Does the Unemployment Rate Measure?
The unemployment rate is the share of the labor force that has no job, has looked for work in the past four weeks, and is available to start. It is one number among several, and the others answer different questions. Reading the headline rate without the rest is like reading a team’s scoring average without its win-loss record.
| Indicator | What it measures | Denominator | What it answers |
|---|---|---|---|
| Unemployment rate (U-3) | Share of the labor force without a job and actively looking | Civilian labor force | How many active job seekers are out of work |
| Labor force participation rate | Share of the civilian population in the labor force | Civilian noninstitutional population, age 16 and over | How much of the adult population is working or looking |
| Employment-population ratio | Share of the civilian population holding a job | Civilian noninstitutional population, age 16 and over | How much of the adult population is actually working |
| U-6, broader underutilization | Unemployed, plus marginally attached workers, plus part-time workers who want full-time hours | Civilian labor force plus marginally attached | How much unused labor is sitting on the sidelines |
None of these is wrong. They simply use different denominators, and a change in one can run opposite to a change in another in the very same month. The unemployment rate can only fall if the number of unemployed people shrinks or the labor force grows, and the second route is the one that surprises people.
Who Counts as Employed, Unemployed, or Outside the Labor Force?
Every person age 16 and over who is not on active-duty military and not living in an institution is sorted into exactly one of three groups. The rules are written down in advance and applied to answers given in a telephone or in-person interview. A person is counted as unemployed only if all three of the following are true.
- No job. The person did not hold a paying job, worked as an unpaid family worker for at least 15 hours in the reference week, or had a job but was temporarily absent.
- Actively looking. The person did something specific in the past four weeks, such as contacting an employer, sending a resume, or checking a job board. Simply hoping for a call does not count.
- Available to start. The person could have taken a job in the reference week or within the following two weeks, barring an illness or a personal reason such as a bereavement.
Two categories get argued about most, so they are worth being precise about. A person on a temporary layoff who is waiting to be recalled counts as employed, not unemployed, no matter how worried they are. A person who stopped looking for work four months ago is not unemployed, and is not part of the labor force at all, which means they disappear from the denominator as well as the numerator.
Working part time counts as employed. A barista with twenty hours a week who wants forty is employed, full stop. The only place that kind of worker shows up is in the broader U-6 measure. Students with a light class load, retired people, and anyone who simply is not looking are all classified as outside the labor force.
How Does a Household Survey Measure Unemployment?
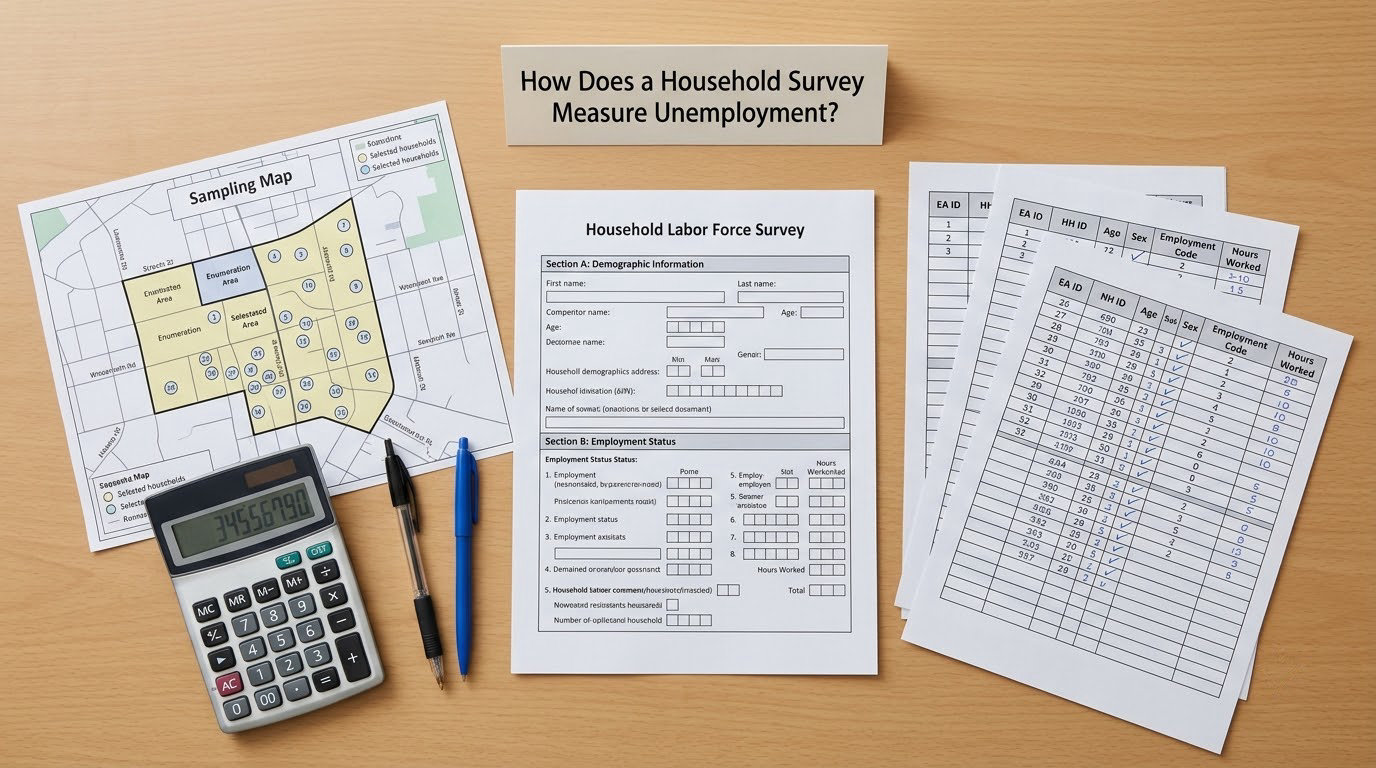
The household side of how unemployment numbers are measured runs on the Current Population Survey, which the U.S. Census Bureau collects on behalf of the Bureau of Labor Statistics. It is the oldest continuous survey of its kind in the world, running since 1948, and it samples roughly 60,000 households spread across the country every month.
Interviewers call or visit those households and ask every resident age 16 or older a short set of work questions. The critical detail is timing. Each person’s status is measured for the reference week, which is the week containing the 12th day of the month. That single rule is what lets the agency describe a consistent snapshot even though the interviews happen over a spread of days.
From the answers, the agency builds national and regional unemployment rates, plus the participation rate, the employment-population ratio, and the broader U measures. State and local areas go through a separate program that uses a larger sample for smaller places, which is why a county-level number can move more than a national one.
What Does Payroll Data Show?
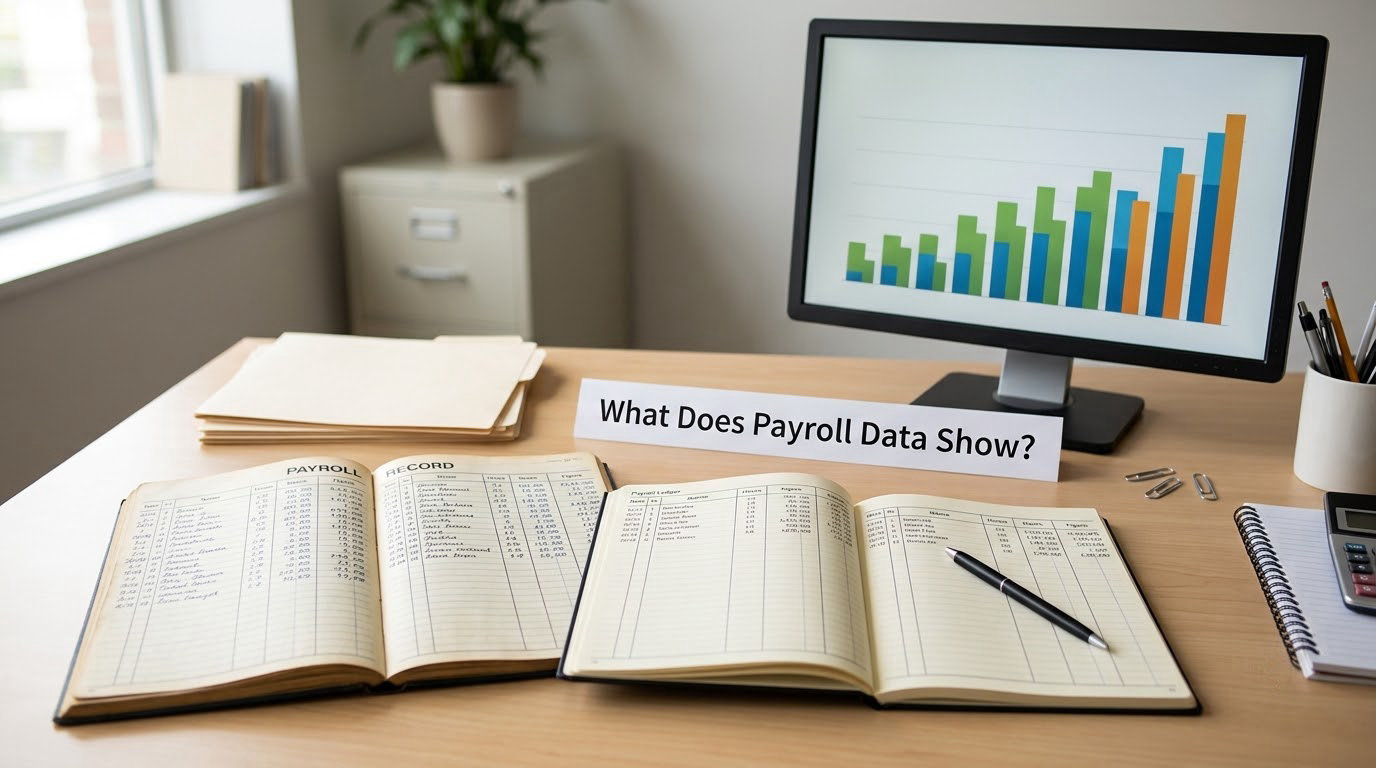
The payroll side answers a narrower question: how many jobs exist at covered worksites, and how much are they paying. Employers report this directly rather than through a survey of people. The resulting series is the widely reported nonfarm payrolls figure, and it lands roughly a week before the household numbers for the same month.
Two features of that count catch people out. It counts jobs, not people, so someone holding two jobs appears twice and a person who left one job for another is counted as no net change. And it only covers employers who are on the payroll filing system, which means self-employed people, farm workers, many gig workers, and people working for households or nonprofit organizations never appear in it at all.
How Unemployment Numbers Are Measured Across the Two Main Sources
The two sources agree in a healthy labor market and diverge in a weak one. Knowing which one a journalist quoted tells you a lot about the claim.
| Feature | Household survey (CPS) | Payroll survey (CES) |
|---|---|---|
| Who reports | People describe themselves, through Census Bureau interviewers | Employers report pay and headcount |
| What is counted | People, classified by what they were doing in the reference week | Jobs at covered worksites |
| Sample size | Roughly 60,000 households per month | Hundreds of thousands of worksites |
| Timing | Published with a lag after the reference month | Arrives a week or so earlier |
| Main use | Unemployment rate, participation, the U measures | Job gains and losses, average hourly earnings |
| Main blind spot | Sampling error on small areas and subgroups | Self-employment, undeclared gig work, small private households |
So a strong payroll number does not automatically mean the unemployment rate will fall, and a flat payroll number does not mean people are staying jobless. The two series measure different populations with different definitions and different lags. When they point in opposite directions, that is a signal worth understanding rather than an error to pick a winner over.
How Is the Unemployment Rate Calculated?
The calculation itself is short. The labor force is everyone counted as employed plus everyone counted as unemployed, and the rate is the unemployed share of that total, multiplied by 100.
Unemployment rate = (Unemployed ÷ Labor force) × 100
Consider a hypothetical month. Suppose there are 5,000 unemployed people, 120,000 employed people, and 25,000 adults who are not in the labor force because of retirement, school, or discouragement. The labor force is 125,000, so the unemployment rate is 5,000 divided by 125,000, which is 4.0 percent.
Now the interesting part. Suppose those 25,000 people all start looking for work and stay unemployed. The unemployed count rises to 30,000, the labor force rises to 150,000, and the rate moves to 6.0 percent. The labor force grew, so people are looking harder than before, and the rate correctly went up.
Now reverse it. If 5,000 of those previously unemployed workers stop searching, they move out of the labor force entirely. Unemployed falls to 25,000, the labor force falls to 120,000, and the rate is 25,000 divided by 120,000, which is 4.17 percent, essentially unchanged. Nobody found a job, and the headline number barely moved. That is the arithmetic behind the complaint that the rate improves without any good news.
The same reversal works in a rising market. If discouraged workers re-enter and take jobs, both the numerator and denominator grow together and the rate can fall. Falling is not automatically fake, and rising is not automatically bad news. The direction of participation tells you which story you are looking at.
Why Are Unemployment Figures Revised?
Almost every published unemployment figure is a first estimate that gets adjusted twice before it settles. The reason is mundane: people are late with forms, establishments revise their own payroll records, and seasonal patterns have to be recalculated as new years of data arrive.
The first revision typically arrives with the release two months after the original month, when late-responding households are incorporated. The larger, annual benchmark revision comes later, once every establishment that is now on the payroll system has reported, so the payroll survey can be recalculated from a fresh and larger list of employers. That second step can shift the entire historical series, including levels that were published years ago.
This is normal and not a sign of manipulation, but it does change how you should treat a number you saw in the news. A figure from the most recent month is provisional; the same figure six months later is the better number to reason with. The series on the agency’s own tables is the revised version, while the text of a fresh headline is the first estimate.
What Is Seasonal Adjustment?
Raw monthly data in many parts of the economy follows a reliable yearly pattern, and the statistics agency estimates that pattern and subtracts it so that month-to-month changes reflect real activity. Without adjustment, a summer tourism state looks like it is booming in June and collapsing in September, every year, forever.
Adjustment is what makes the adjusted series move around a bit after each revision, because the factors themselves are recomputed once a year using the latest two years of data. Comparing an adjusted figure from this month’s release with an unadjusted figure from an old news story is a common way to arrive at a wrong conclusion.
The short rule is simple: use seasonally adjusted figures for month-to-month comparisons, and unadjusted figures for comparisons that are always seasonal, such as holiday hiring or summer tourism jobs. Mixing the two produces noise that looks like signal.
Which Unemployment Rate Should You Use?
The headline U-3 rate is the default because it is the most stable and the most comparable over time. But it is a narrow measure by design, and the alternatives exist for good reasons. These are the six the Bureau of Labor Statistics publishes.
| Measure | Who is counted as unemployed | Denominator | Best used for |
|---|---|---|---|
| U-1 | Unemployed 15 weeks or longer | Civilian labor force | Persistent or long-term joblessness |
| U-2 | Job losers and people who finished temporary jobs | Civilian labor force | Separating layoffs from other exits |
| U-3 | No job, looked in the past four weeks, available to start | Civilian labor force | The headline rate everyone quotes |
| U-4 | U-3, plus people on temporary layoffs who are not looking | Civilian labor force | Adding withdrawn but still job-attached workers |
| U-5 | U-3, plus marginally attached people who want and are available for work | Civilian labor force plus marginally attached | Counting people who want work but stopped searching |
| U-6 | U-5, plus part-time workers who want full-time hours | Civilian labor force plus marginally attached | The broadest slack measure |
The term to learn here is marginally attached, which is the official label for people who wanted and could take a job, looked at some point in the past twelve months, and are not currently searching. A discouraged worker is a specific subset: marginally attached people who say they want a job but are not looking because they think none is available, or they have been trying too long.
A note on the broader measures, since they get misused. Research on marginally attached workers has found most of them leave the labor force over the following months rather than move into jobs. That is worth knowing before treating U-6 as a count of jobs waiting to be filled.
For steady signal on participation, the prime-age employment-population ratio, which covers ages 25 to 54, is often the most useful single number because it is not distorted by large cohorts of students or retirees moving through the statistics.
How Do Unemployment Rates Change Across Countries?
Comparing a national rate to another country’s rate is harder than it looks, because definitions, survey timing, and reference periods differ. The International Labour Organization publishes harmonized standards that many countries follow, which narrows the gap without closing it.
Eligibility age is one difference. A country may count people from age 14 as part of the labor force while another uses 16, and that shifts the denominator. Survey frequency matters too: a rate built from a quarterly survey cannot be compared month by month with one collected weekly. Some countries also use labor force surveys and others rely on administrative records from unemployment insurance systems, which cover only people who ever claimed a benefit.
The practical result is that a rate comparison is only meaningful when the definitions line up. Look for the reference period, the minimum age, and the source of the data before concluding that one country has a weaker labor market than another.
What Are the Limitations of Unemployment Statistics?
Nothing here is a reason to discard the numbers. It is a reason to read them alongside other figures, and the critiques from both directions are reasonable.
- Discouraged workers vanish. People who stop searching leave both the numerator and the denominator, so the rate can improve with no job creation at all.
- Part-time work counts the same as full-time. A worker with ten hours a week and a worker with forty are both employed. Only U-6 registers the difference.
- Informal and undeclared work is invisible. Gig and cash work that never appears on a payroll is missed by the payroll survey, and may be under-reported in a household interview.
- Sampling error puts a margin around every estimate. Household survey figures come from a sample, so small month-to-month wiggles are partly noise, and the statistical agencies publish confidence intervals for the national rate.
- Job quality is not measured. The rate treats a full-time permanent job and a forced part-time shift the same way, and says nothing about pay, benefits, or scheduling stability.
- Regional and demographic averages hide a lot. One national number can describe a strong metro and a weak rural county at the same time, and averages across age groups conceal very different experiences.
In forums and comment threads, hiring managers say the same thing repeatedly: a low headline rate does not translate into easy hiring, and senior candidates sit on long searches. That is consistent with the measurement rules rather than a contradiction of them. A tight rate for a broad, entry-level category tells you little about a specialized one.
Frequently Asked Questions
Is the unemployment rate the percentage of all adults without a job?
No. It is the share of the labor force without a job, not of all adults. The denominator includes only people counted as employed or unemployed. Retirees, students, and anyone not working and not looking are outside the labor force and are not part of the calculation, which is why the rate sits far below the share of adults without a paying job.
Why can the unemployment rate fall even when few people find work?
Because the rate is a fraction with people in the denominator. If workers who are unemployed stop searching, they are reclassified as outside the labor force, shrinking both the numerator and the denominator. The unemployed count falls without a single job being filled, so the rate can fall or hold steady in a month with no improvement in hiring.
Why does the unemployment rate sometimes change after it is first published?
The first release is an early estimate built on partial returns. Later revisions add late-responding households and corrected payroll records, and an annual benchmark revision recalculates the whole history using a more complete employer list. The published figure is therefore the official number, and the one in the original headline is a provisional snapshot.
Are people working part time counted as employed?
Yes. Part-time workers are counted as employed, including anyone who wanted full-time hours and could not get them. That frustration is what separates the headline rate from U-6, which adds part-time workers seeking full-time positions to the unemployed count. On its own, the headline rate cannot distinguish underemployment from full employment.
Why does a country’s unemployment rate differ from another’s?
National definitions vary even when countries follow shared international standards. Minimum working age, the survey reference period, how often the survey runs, and whether the data come from a household survey or from unemployment insurance records all change what gets counted. Comparing two countries without checking those four things can produce a gap that is purely definitional.
Does a low unemployment rate mean the economy is healthy for everyone?
No. A low rate means few active job seekers are without work, which says nothing about people who have left the labor force, workers in unwanted part-time roles, or regions lagging behind the national average. Reading the rate with the participation rate, the employment-population ratio, and the broader U-6 measure gives a much fairer picture of who is and is not working.
What to Look at First
Start with the labor force, not the rate. If the number of unemployed people is falling while the labor force is shrinking, the improvement is arithmetic rather than hiring. If the labor force is growing, the falling rate means people are re-entering the labor market, which is a much better sign.
Then put the headline figure next to the participation rate, the employment-population ratio, and U-6, and read them across several months rather than one. Those four together answer who is working, who is looking, and who has quietly stepped away. Remember that how unemployment numbers are measured is not a detail of the story, it is the story: the definition decides what the headline rate can and cannot tell you, and knowing the definition is what lets you read the number honestly.