The Consumer Price Index is a monthly scorecard showing how much the price of a typical basket of groceries, rent, fuel and other everyday purchases has changed over time. Understanding it comes down to one thing: the index number is a level, not a percentage, so it only means something next to another number.
That single point trips up more readers than anything else in economics. A CPI reading of 320 does not mean prices are 320 percent higher than last year, and it is not a score out of 100 where high is bad. It is a marker on a timeline, and you need two markers to know which way prices moved.
Below is a plain-language walkthrough: what the index covers, how the Bureau of Labor Statistics builds it, how to read a release, and where the number quietly stops matching your own grocery bill.
Table of Contents
- What Is the Consumer Price Index?
- A short glossary of the terms you will meet
- What Does the Consumer Price Index Measure?
- How Is the Consumer Price Index Calculated?
- How the Consumer Price Index Is Calculated Step by Step
- Consumer Price Index vs. Inflation: What Is the Difference?
- Which measure does the Federal Reserve actually target?
- How to Read an Inflation Report
- What Affects the Consumer Price Index?
- What Are the Limitations of the Consumer Price Index?
- How Can You Use the Consumer Price Index in Everyday Life?
- Frequently Asked Questions
- What does a CPI of 120 mean?
- Is a higher CPI good or bad?
- What is the difference between the CPI and inflation?
- Why doesn’t the CPI match my own cost of living?
- What is the difference between headline CPI and core CPI?
- Where can I find the official CPI data?
- What to Take Away
What Is the Consumer Price Index?
The simplest version: the Consumer Price Index tracks how much the cost of a fixed basket of goods and services bought by American households has changed over time. If the basket cost 100 in the base period and the index later reads 120, the same basket costs 120. Prices went up 20 percent against that starting point.
The technical version is longer but not much harder. The Bureau of Labor Statistics measures the average change over time in prices paid by urban consumers for a market basket of consumer goods and services. The standard index, called CPI-U, covers about 93 percent of the U.S. population, and its base period is 1982 to 1984, set equal to 100.
Two words in that definition carry most of the meaning. Average tells you the index is a national summary, not your household’s receipt. Urban consumers tells you it is built from the spending patterns of people living in cities and metropolitan areas, which is nearly everyone but not literally everyone.
A short glossary of the terms you will meet
- Basket: the list of specific items the index tracks, currently several hundred goods and services from cereal to gasoline to toothache medicine.
- Base period: the period assigned the value 100. For CPI-U that is 1982 to 1984.
- Weight: how much each category counts toward the total, based on how much households actually spend on it.
- Index number: the resulting score. It is a position on a scale, not a percentage.
- Core CPI: the version that leaves food and energy out.
- MoM and YoY: month-over-month and year-over-year, the two ways a release is compared to earlier readings.
What Does the Consumer Price Index Measure?
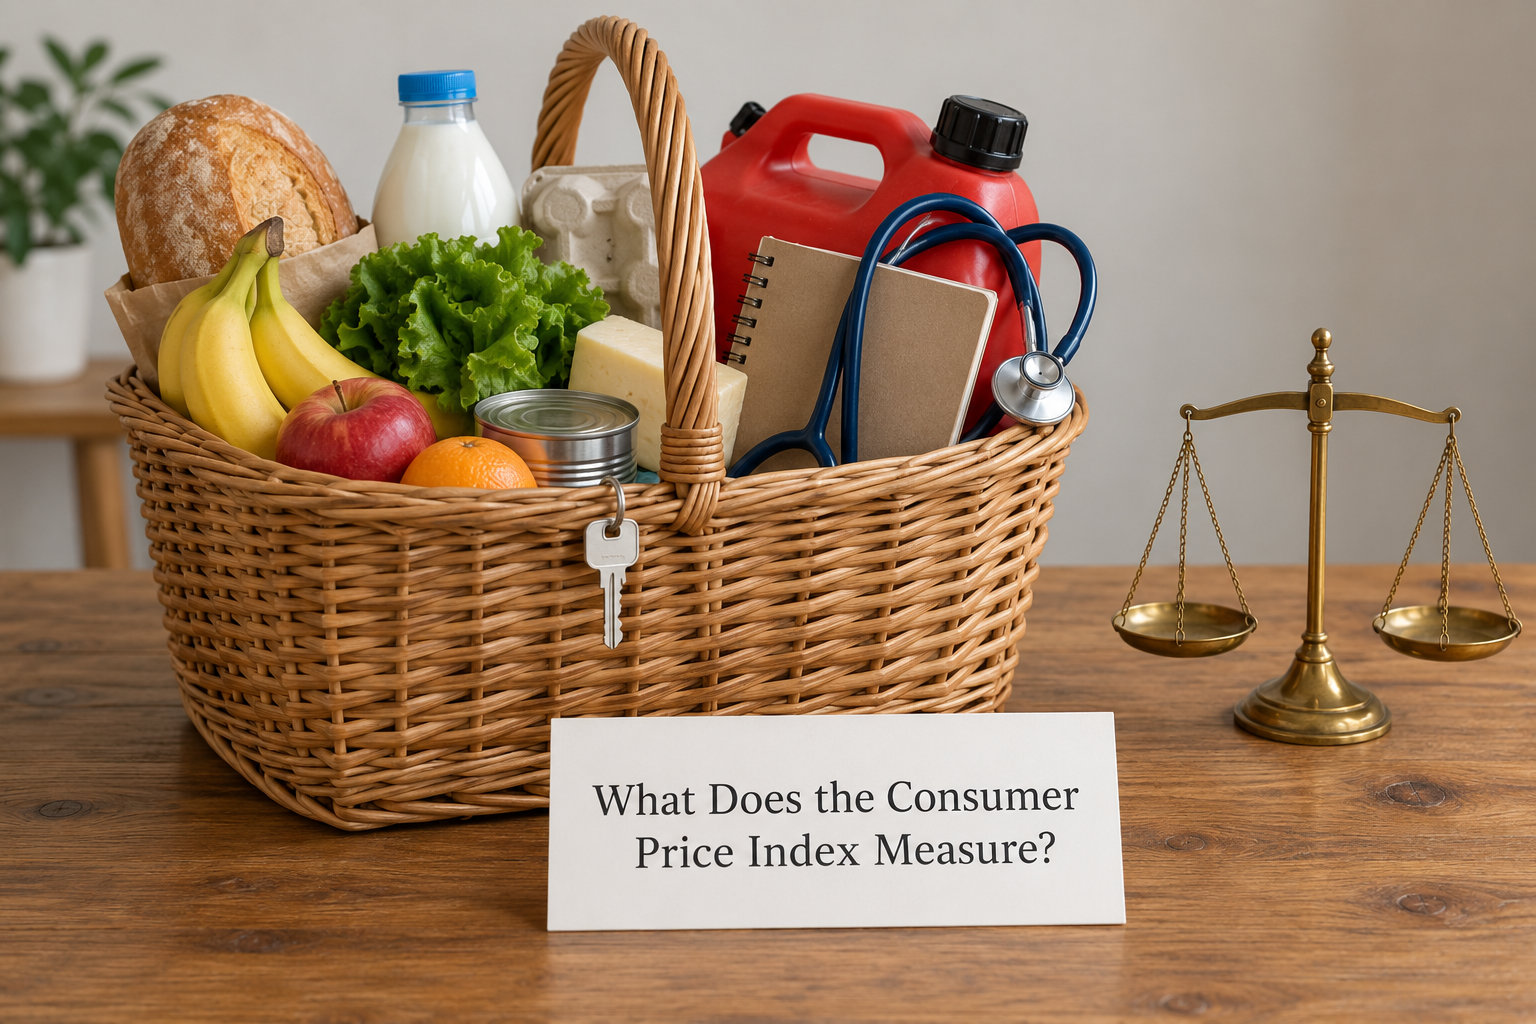
It measures changes in the out-of-pocket prices urban households pay, gathered from eight major categories. Every item in the basket sits inside one of them, and each category carries a weight reflecting its share of household spending.
| Major category | What it covers | Approximate share of the basket |
|---|---|---|
| Housing | Rent, mortgage interest, utilities, household furnishings | About 36 percent |
| Transportation | Gasoline, new and used vehicles, maintenance, insurance, airfares | About 16 percent |
| Food and beverages | Grocery store food, restaurant meals, coffee, snacks, alcoholic drinks | About 13 percent |
| Medical care | Doctor visits, prescriptions, dental care, hospital services | About 8 percent |
| Other goods and services | Personal care, tobacco, pet supplies, financial and legal services | About 8 percent |
| Recreation | Movies, sports equipment, cable, travel, games, reading materials | About 7 percent |
| Apparel | Clothing, shoes, jewelry, outerwear | About 3 percent |
| Education and communication | Tuition, school supplies, phones, internet, postal services | About 2 percent |
These shares shift over time because household spending habits shift, and the BLS refreshes the weights from its Consumer Expenditure Survey rather than freezing them for decades.
What the index does not measure is just as important. It is not a measure of asset prices, so home values and stock portfolios sit outside it. It does not track what the typical household actually pays, since there is no typical household. And it does not measure whether the things you buy got better, only what they now cost.
How Is the Consumer Price Index Calculated?
The process has four parts: survey households to see what they buy, choose a basket that reflects those purchases, collect prices for those items every month, and convert the prices into one weighted index number.
Step one, the survey. The Bureau of Labor Statistics asks a sample of households across the country what they spent money on over the previous year. Those spending patterns decide what belongs in the basket and how much each category should count.
Step two, the basket. Out of everything households reported, statisticians select a few hundred specific items that can be priced consistently month after month. Bread, a specific grade of gasoline, a standard cable package. Specifics matter because the index needs the same thing measured repeatedly.
Step three, price collection. Prices come from hundreds of thousands of quotes gathered each month across urban areas, from retailers, rental databases, service providers and direct company reporting for items like mobile plans.
Step four, the arithmetic. Each item’s price is divided by its price in the base period to get a relative figure, those relative figures are multiplied by their weights, and the results are summed into one index number. That is the number printed in the news.
A worked example makes it concrete. Suppose a trimmed basket has three items with base-period prices of 10, 20 and 70, so the basket costs 100. Weights follow spending share: say 10 percent, 20 percent and 70 percent. Now the item priced at 10 rises to 11 and the item priced at 70 rises to 77, while the item priced at 20 stays put. The weighted result lands above 100, and prices are up.
How the Consumer Price Index Is Calculated Step by Step
That is the theory. Here is the practical routine for following a real release, in the order you would actually do it.
- Check the reference period first. A release published in the middle of one month reports the previous month. The reference period tells you which stretch of time the numbers describe.
- Look at the headline index level, not just the change. The all-items index number is the headline figure most reports quote.
- Read the percentage changes in the tables below it. The release gives you the seasonally adjusted 1-month and 12-month percentage changes so you do not have to compute them.
- Do the arithmetic yourself when it matters. To find the change between two index levels, subtract the earlier level from the later one and divide by the earlier one, then multiply by 100.
- Separate signal from noise. Food and energy swing month to month. Core CPI strips those out and gives a steadier read on underlying price pressure.
- Compare against the base period. An index level is only interpretable next to what it means relative to the 1982 to 1984 baseline of 100, and against its own recent history.
Consumer Price Index vs. Inflation: What Is the Difference?
The index is the thermometer. Inflation is the temperature change. The Consumer Price Index measures the level of prices at a point in time, while inflation is the rate at which that level is moving, and the two get confused constantly.
Say the index reads 310.4 in one month and 321.4 three months later. The index is high, which tells you nothing on its own about whether prices are still climbing. The change between the two readings does: 11 points divided by 310.4 is roughly 3.5 percent over the quarter.
Here is the arithmetic worth keeping in your pocket. Percentage change equals (new level minus old level) divided by old level, times 100. And inflation is usually quoted year-over-year, which compares a month with the same month twelve months earlier. A slower inflation rate still means prices are rising, just more slowly than before.
That distinction matters in conversations about wage increases. A 3 percent raise during 3 percent inflation keeps purchasing power roughly flat. It is not a raise in real terms, and no amount of index-watching changes that arithmetic.
Which measure does the Federal Reserve actually target?
The Federal Reserve targets the core PCE price index at 2 percent inflation over the longer run, and it does not use CPI. The PCE index covers more of what people pay, including some employer-paid costs such as health coverage, and it substitutes more readily toward cheaper comparable options rather than holding the basket rigidly fixed.
That choice trips people up, because every interest-rate decision story quotes a PCE number while every household budget conversation quotes the CPI. Both are published monthly, both track the same underlying reality, and they rarely move by exactly the same amount. When a Fed official speaks, listen for which one is being used.
The Fed reads the two series as complementary rather than competing. CPI gives a fine-grained look at what shoppers actually paid at the shelf this month, and PCE gives a broader measure of the cost of living that matches how the Fed frames its target. A move in one that is absent from the other tends to be the interesting one.
How to Read an Inflation Report
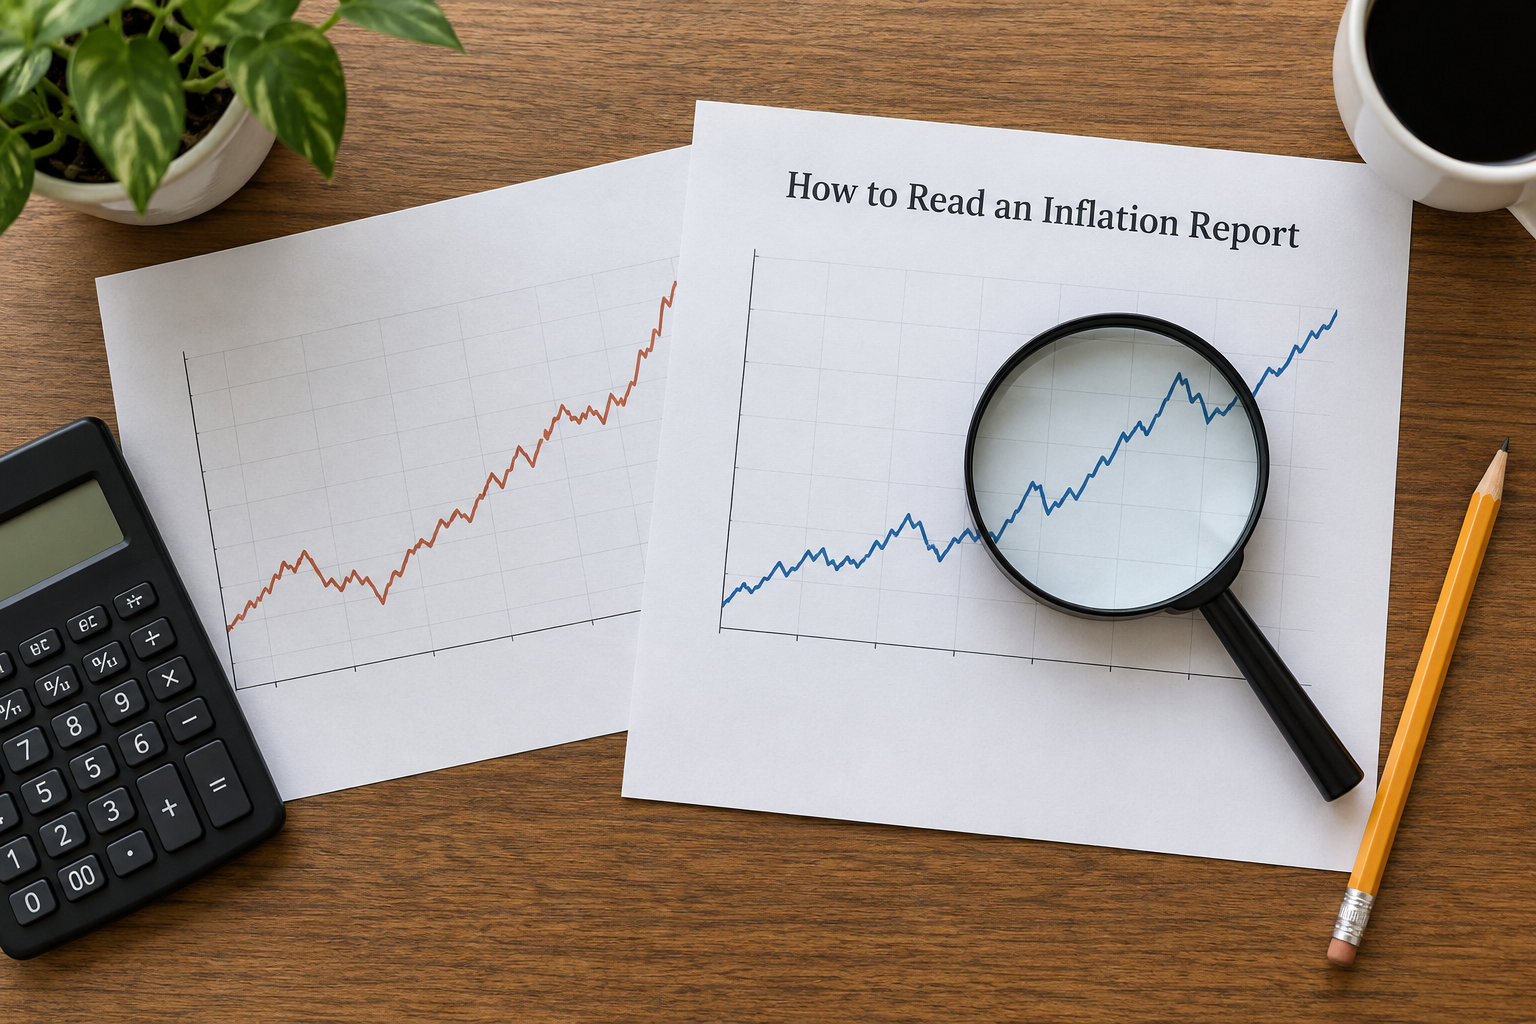
Read it in a fixed order so you do not grab the wrong number. Identify the reference period, note the headline index level, read the seasonally adjusted month-over-month change, then read the unadjusted year-over-year change, and finally check whether food and energy did something unusual this month.
Month-over-month answers: what changed since last month? It moves fast and it swings. Grocery prices do that seasonally, so the seasonally adjusted version exists to strip predictable yearly patterns out before you read it.
Year-over-year answers: what changed since this time last year? It smooths the seasonal noise and is the number most news reports quote, because it is easier to compare to the same month in the past.
Headline versus core is the next fork. Headline includes everything. Core removes food and energy, which are the noisiest categories and which most people spend a larger share of their income on than the average implies.
| Measure | What it includes | Who publishes it | Main use |
|---|---|---|---|
| Headline CPI | All items in the basket, food and energy included | Bureau of Labor Statistics | Rent reviews, Social Security adjustment, contract escalation |
| Core CPI | Everything except food and energy | Bureau of Labor Statistics | Watching underlying price pressure |
| PCE price index | Wider scope, including some costs paid by employers or government | Bureau of Economic Analysis | The Federal Reserve’s preferred inflation gauge |
| Core PCE | PCE without food and energy | Bureau of Economic Analysis | The Federal Reserve’s longer-run inflation target |
The PCE index is built with different coverage and a different formula, and it historically runs a bit below the CPI. None of these four is the correct one in general. They answer different questions, which is why a headline and a core figure rarely tell the same story in the same month.
All of this comes from public data you can read yourself. The Bureau of Labor Statistics publishes the monthly release with its full set of tables on a fixed schedule, usually in the second half of the month for the previous month’s reference period, and keeps a downloadable series going back decades. If a number in a news story looks strange, the underlying series is worth thirty seconds of checking.
Other countries run their own versions, and the differences are instructive. The UK Office for National Statistics publishes a consumer prices index, the euro area uses Eurostat’s harmonised index of consumer prices, and Statistics Canada publishes a Consumer Price Index built on its own expenditure survey. None of them is directly comparable to the US figure without adjustment, and comparing them without doing that adjustment is its own source of confusion.
What Affects the Consumer Price Index?
Six forces do most of the moving.
Supply conditions. A drought, a hurricane, a port shutdown or a strike tightens supply, and the affected category rises. Because food and energy have large weights, weather and energy markets can swing the headline on their own.
Demand. When spending outruns the economy’s capacity to produce, sellers can raise prices without losing customers. That is the demand-pull pattern, and it is what most people picture when they say inflation.
Energy prices. Gasoline, heating oil and electricity feed into transport costs, plastics, chemicals and delivery charges, so an energy move shows up in other categories with a lag.
Exchange rates and imports. A dollar that loses value makes imported goods cost more at the border. A large share of what households buy is produced abroad even when it is not obviously imported.
Taxes and regulation. A fuel tax change or a new fee shows up in the price a household pays, so policy moves the index directly.
Seasonality and discount cycles. Some price movements are predictable and repeat every year. Airfares and hotel rates dip in winter and climb in summer, while apparel and fresh produce follow their own patterns.
What Are the Limitations of the Consumer Price Index?
Being straight about the weak points is what separates a useful explanation from a sales pitch, because these are the reasons your own experience can disagree with the national number.
- Substitution. When a product gets expensive, people switch to a cheaper one and buy less of the expensive one. The index holds the original basket fixed, so it misses the substitution that actually softened your bill.
- New goods. A new model of phone or television shows up as more expensive than the one it replaced, which reads as inflation even though the new version does more.
- Unmeasured quality change. When a service quietly improves, its price rises and the index counts it as inflation while ignoring the gain.
- Shelter is a model, not a receipt. Housing carries roughly a third of the weight, and most of that is not what homeowners actually pay. A large slice is an imputed figure called owner’s equivalent rent, which estimates what a home would rent for rather than what the homeowner pays in mortgage or upkeep. Homeowners argue about this one constantly on r/Economics, and they are not wrong that it behaves differently from an actual lease.
- National averages. Prices for housing, utilities and childcare vary enormously by region and by income level, so a household spending heavily on those items can experience something quite different from the headline.
None of this means the number is fake. It means the number describes a constructed average of a specific basket, and the construction makes choices on your behalf.
How Can You Use the Consumer Price Index in Everyday Life?
The index is a tool once you know what it measures. A few places it shows up in ordinary life.
Rent reviews and lease clauses. Many leases tie annual increases to a published index, sometimes CPI-U and sometimes CPI-W, the version based on a different population sample. Check which one your contract names before assuming a number.
Wage and salary escalation. Cost-of-living clauses in union agreements and executive contracts frequently reference the CPI with a cap, a floor or a lag. Two years back, or the average of three years, are common variants, and the wording decides your result.
Freight and service contracts. Pricing that adjusts monthly with the index needs the base-month value and the current value. That is all you need to compute an adjusted figure using the arithmetic above.
Here is a full worked example on illustrative figures, because it is the part people most often get wrong. A storage contract sets monthly fees to adjust each year by the change in the all-items CPI-U, using June as the reference month in both years. The starting June reads 314.540 and the following June reads 328.300.
| Step | Calculation | Result |
|---|---|---|
| 1. Index base value | June of the starting year | 314.540 |
| 2. Index current value | June of the following year | 328.300 |
| 3. Difference | 328.300 minus 314.540 | 13.760 |
| 4. Percentage change | 13.760 divided by 314.540, times 100 | 4.37 percent |
| 5. Applied to a monthly fee of 400 | 400 times 1.0437 | 417.49 |
Note what the index never appears as: a multiplier on its own. You do not multiply a fee by 328.3. You calculate the change from the base value first, then apply that percentage, and the base period stays at 100 while the fee stays at whatever the contract says it started at.
Checking official announcements. Social Security and several federal benefit programs adjust with CPI-U, and a great many private benefits reference it too, which is why each spring people look for the second-quarter average.
Your own budget. Compare your spending against the categories you actually buy. A household that spends heavily on rent will feel shelter more sharply than the headline suggests, while one that spends on travel and cars tracks transportation closely. Two people with the same income can see different inflation, and that is expected rather than a flaw in your math.
A note on scope: none of this is financial advice. Index-linked terms and benefit rules vary by contract, by state and by program, and they change, so read the specific document or ask the party that administers it.
Frequently Asked Questions
What does a CPI of 120 mean?
A CPI of 120 means the current basket of goods and services costs about 20 percent more than it did in the base period, the years 1982 to 1984 set at 100. It does not mean prices are 20 percent higher than last month or last year. To find that, subtract the earlier index level from the later one, divide by the earlier one, and multiply by 100.
Is a higher CPI good or bad?
Neither on its own. The index level rises as prices rise, so a high number means more expensive goods, not a good or bad score. What matters is the direction and size of change: a steadily rising index means prices climbing faster than wages, and a rising index paired with rising pay that outpaces it means purchasing power improving.
What is the difference between the CPI and inflation?
The CPI is the level of prices measured at a point in time. Inflation is the rate of change in that level, usually quoted as a percentage over twelve months. So the CPI of 310.4 describes how expensive the basket is, while a statement that prices rose 3 percent describes how fast that changed. Reporting a CPI number as if it were an inflation rate is the most common mistake.
Why doesn’t the CPI match my own cost of living?
The index is a national average built on the spending patterns of urban households generally, and your household is not that average. Big regional differences in housing and childcare, a heavy weight on one category, and the modelled owner’s equivalent rent inside the housing component all push your experience away from the headline. The index also cannot see when you substitute a cheaper product for a pricier one.
What is the difference between headline CPI and core CPI?
Headline CPI includes everything in the basket, including food and energy. Core CPI removes those two categories, which are volatile and can swing a month without any underlying shift in price pressure. Traders and policymakers watch core for a steadier signal, while rent reviews and benefit adjustments almost always reference the headline figure.
Where can I find the official CPI data?
The Bureau of Labor Statistics publishes the consumer price index release and its detailed tables on its own website, with a scheduled release date each month and a public data series you can download for any past month. Statistics agencies in other countries publish their own versions, such as the UK Office for National Statistics, Eurostat in the euro area, and Statistics Canada.
What to Take Away
Compare index levels, never index numbers on their own. Pull the current reading and the reading from the month you care about, run the subtraction and division, and you have the number that actually means something.
After that, check which categories you actually spend on, and expect the national average to describe your household imperfectly. That gap is not a scandal. It is arithmetic.