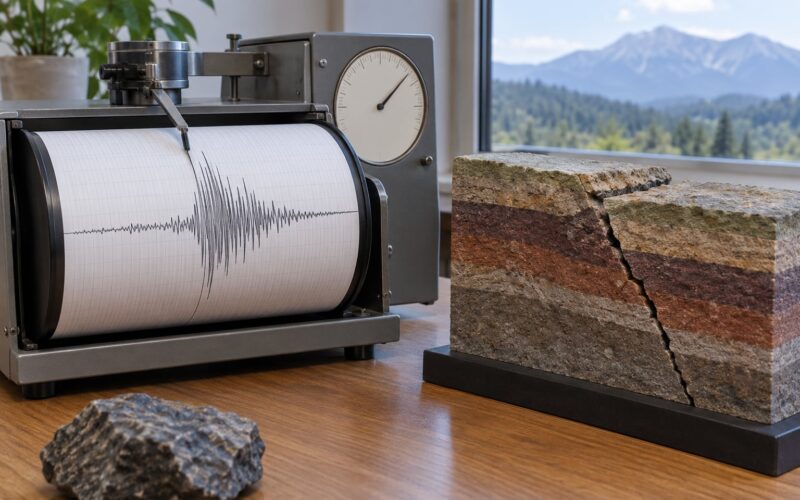
Scientists do not guess an eruption date. They watch a volcano the way a doctor watches a patient, tracking earthquakes, ground swelling and gas output across an instrument network, and they publish probabilities, not promises.
How volcanic eruptions are predicted, in short: three signals carry most of the weight. Seismicity, ground deformation and gas emissions. When all three move at once, the volcano observatory issues a probabilistic forecast and raises its alert level. The rest is context, physics and honest uncertainty.
The awkward part, and the part that gets mangled in news headlines, is that no one can hand you a date. What forecasters can do is narrow the window from decades to days, and say how confident they are. That is the difference between a forecast and a guarantee, and understanding it is the whole game.
I have read enough volcano bulletins to be wary of confident language. When a headline says a volcano could erupt, it is usually reporting that a probability rose, not that a countdown started.
Table of Contents
- What Does It Mean to Predict a Volcanic Eruption?
- How Volcanic Eruptions Are Predicted: The Main Monitoring Methods
- What Do Earthquakes Tell Scientists About an Eruption?
- How volcanic eruptions are predicted from seismic signals
- How Do Gas and Ground Measurements Change the Forecast?
- Ground deformation answers a different question
- Can Satellite Images Help Predict Volcanic Eruptions?
- How Do Scientists Estimate the Likelihood and Timing?
- What Do Volcano Alert Levels Mean?
- Why Can’t Scientists Predict the Exact Day of an Eruption?
- What Happens When Monitoring Suggests an Eruption?
- Frequently Asked Questions
- Can scientists predict exactly when a volcano will erupt?
- Is an increase in earthquakes around a volcano a sign that an eruption is coming?
- How early can scientists warn people about a volcanic eruption?
- What is the difference between an eruption forecast and a long-term volcanic hazard assessment?
- Does volcanic activity on a monitoring app mean an eruption is imminent?
- Which volcano observatories or agencies should readers trust for local warnings?
- Conclusion
What Does It Mean to Predict a Volcanic Eruption?
Prediction means estimating, with stated confidence, the probability that an eruption will occur inside a given window and roughly how big it will be.
It is not the same as a long-term hazard assessment. Hazard mapping asks a different question: given that this volcano erupts every few decades, which towns, rivers and roads fall inside the likely footprint of lava, pyroclastic flows or lahars? That work is done once, over years, and it is what shapes zoning and evacuation planning.
Forecasting is the live version, updated daily. Think of hazard assessment as the map of where water would go if the dam broke, and forecasting as the question of whether it is about to break.
How Volcanic Eruptions Are Predicted: The Main Monitoring Methods

Every forecast rests on a network. A volcano observatory runs some combination of seismic stations, tiltmeters, GPS receivers, gas spectrometers, cameras and satellite feeds, then watches for signals that depart from the volcano’s own baseline.
Five systems do most of the work:
- Seismic monitoring. A local network of seismometers records every tremor, every small quake, every change in wave character.
- Ground deformation. Tiltmeters, borehole strainmeters and GPS stations measure millimetres of swelling or subsidence.
- Gas monitoring. Multi-GAS instruments measure sulfur dioxide and carbon dioxide flux, and the ratio between them.
- Thermal and satellite observation. Thermal cameras, radar interferometry and orbital sensors catch heat, deformation and ash plumes.
- Hydrology and infrasound. Stream gauges, lake levels and barometric sensors track lahars and pressure waves from deep magma movement.
The word doing the work there is combination. Any single signal has innocent explanations. Ground inflation happens with no eruption, as at Campi Flegrei and Yellowstone during recent decades of caldera unrest. A seismic swarm happens at Kilauea every few years, and at Etna almost continuously, without an eruption.
It is the convergence of independent signals, at rates the volcano has not shown before, that moves an alert level.
What Do Earthquakes Tell Scientists About an Eruption?
Magma pushing through cracks generates earthquakes, so seismicity is usually the earliest and most sensitive precursor. That is why almost every eruption forecast on record was preceded by a change in earthquake behaviour.
How volcanic eruptions are predicted from seismic signals
Volcanologists sort seismic signals into three families, and each one points somewhere different.
Volcano-tectonic (VT) events are brittle failures of rock as magma fractures the crust to reach the surface. They are usually shallow, and the count and depth of them map the pathway magma is opening. At Pinatubo in 1991, the swarm that ended the eruption began in April, roughly ten weeks of escalating shallow quakes.
Long-period events have a longer wavelength and often sit deeper in the magma system. They tend to arrive when a large body of fluid magma is moving or pressurising rather than when rock is simply cracking.
Harmonic tremor is a continuous, humming signal with no distinct individual events. It usually means magma is moving steadily through a conduit, and analysts read it as a sign the system is becoming more open and fluid. Persistent tremor is one of the patterns forecasters watch most closely in the last days before an eruption.
What scientists watch is not just the number of events but the trend: accelerating seismicity, events migrating upward or changing depth, and quakes with less and less rock breaking between them.
The limit is equally important. Most earthquakes near volcanoes produce no eruption at all, and swarms can stop and restart for years. A spike in volcano-tectonic seismicity is a reason to watch closely, not a reason to run.
How Do Gas and Ground Measurements Change the Forecast?
Gas tells you about pressure and about where the magma is in its journey, which is why it sometimes changes the picture before deformation does.
Volcanic gases include water vapour, carbon dioxide, sulfur dioxide and smaller amounts of hydrogen chloride and hydrogen sulfide. Magma dissolved in rock releases most of its gas quietly. If that gas cannot escape, pressure builds, and the sulfur dioxide reading tells you whether it is escaping or trapped.
Sulfur dioxide flux is the workhorse measurement. A Multi-GAS instrument sits at a site and pulls air through a spectroscopic cell, reporting hourly flux in tonnes per day. When sulfur dioxide drops sharply while carbon dioxide holds steady, that usually means shallow magma is degassing less, and the ratio between them shifts.
At Pinatubo, sulfur dioxide climbed from its low baseline to roughly 5,000 tonnes a day in about two weeks before the 15 June 1991 eruption. That was the clearest single number in the whole event.
Ground deformation answers a different question
Ground deformation measures the shape of the volcano changing. Magma entering a chamber inflates it, a tiltmeter at the summit registers the tilt, and a GPS receiver three kilometres away shifts by millimetres to centimetres. Strainmeters in boreholes compress rock to detect pressure changes below the surface.
Deformation is slow and stubborn, which makes it a good long-term unrest signal. Around El Hierro in 2011 and again in 2021, the combined GPS and InSAR picture was the backbone of the analysis.
Both have known blind spots. Inflation can occur without an eruption, and an eruption can begin with almost no measurable deformation, particularly when magma reaches the surface through a fracture the instruments are not covering.
Can Satellite Images Help Predict Volcanic Eruptions?
Satellites have quietly become the eyes for volcanoes that have no ground network at all, and most of the world’s active volcanoes do not have one.
Four passes are used regularly. Thermal infrared sensors such as those on Landsat and ECOSTRESS pick up hot spots that indicate fresh lava, a crater lake heating up or steam on new ground. Sentinel-1 and other radar satellites produce InSAR interferograms, in which ground movement between two passes shows up as coloured fringes across the whole edifice.
InSAR can map deformation over tens of kilometres at centimetre scale, which no single tiltmeter can do. It struggles where vegetation or snow decorrelates the signal, or where deformation changes quickly enough between passes that the fringes smear.
Sulfur dioxide satellite instruments detect plumes directly, and weather satellites plus radar and lidar watch ash clouds once they are airborne, which is how aviation advisories get their data.
Lower-resolution thermal scanners such as MODIS can spot a new thermal anomaly within hours. That is detection, not prediction, but early detection feeds the forecast.
How Do Scientists Estimate the Likelihood and Timing?
Once signals are collected, forecasters work through a fairly consistent chain of reasoning.
- Compare against the baseline. Every active volcano has a normal number of quakes, a normal amount of gas and a known deformation history. Anything outside that range is a candidate anomaly.
- Compare with past behaviour. Historical eruption records tell you what style of eruption this volcano produces, roughly how it behaves before an onset, and how long past episodes ran.
- Ask what the signals mean physically. Rising tremor and rising inflation together suggest magma ascent. Deep long-period events with no shallow VT activity suggest pressurisation deeper down, which usually means a longer wait.
- Apply statistical models. The failure forecast method, published by Barry Voigt in 1988, fits a curve to the rate of seismic events and deformation through time and identifies where the system sits on the curve toward failure. When the observed trend first crosses the curve, that is the start of the alarm.
- Publish a probability with a window. The output is a statement like a 50 percent chance of onset within days, plus the reasoning.
Judgement still does the final call. Two forecasters can read the same data differently, which is why observatory bulletins list the evidence and let readers see the reasoning rather than just the conclusion.
What Do Volcano Alert Levels Mean?
Alert levels are a communication tool, not a scientific measurement. They exist so a governor, a pilot or a family can read one line and know what to do.
The USGS runs four levels for US volcanoes:
- Normal. Background volcanic activity, or the state a dormant volcano sits in.
- Advisory (Information). A new type of activity or a hazard change, with no eruption expected.
- Watch (Yellow). Volcano is showing signs of heightened unrest, eruption not expected imminently.
- Warning (Orange). An eruption is underway or thought imminent.
Airspace uses a separate colour code, because the danger to aviation is ash rather than lava. Green, yellow, orange and red track the altitude and spread of the ash plume, and they are set from the same monitoring data but on a different scale.
Other countries run their own systems with different names and thresholds. There is no universal five-step volcano scale, so always read the level against the agency that issued it.
Why Can’t Scientists Predict the Exact Day of an Eruption?
Magma moves through a plumbing system we can only see indirectly. Pipes, dikes and crystal mushes branch in ways no survey maps, and the fracture that finally reaches the surface is often not the one that was inflating.
Sensor coverage is patchy. Most active volcanoes are in Indonesia, the Philippines, Papua New Guinea, Ecuador and Central America, and only a fraction have the instrument density that the well-studied volcanoes in Italy, Iceland and the United States enjoy.
Rock is stubborn about failing. Failure depends on how cracks are distributed, how wet or altered the rock is and how the stress field has shifted, and those details are sampled by a handful of instruments at best.
There is also a comparison worth making honestly. Weather forecasting starts from physical laws and dense observations of a fluid that mixes constantly. Volcanic systems are sparse observations of a slow, ductile, partly inaccessible process. Predictions of a harder problem should be expected to look weaker, and forecasters who publish wide probability ranges are doing the job properly.
What Happens When Monitoring Suggests an Eruption?
Between an anomaly and an evacuation order there is a chain, and most confusion comes from not knowing it exists.
- Analyst review. A duty scientist at the observatory checks the anomaly against the network, the weather and the instrument history, and often finds an instrument fault. This stage removes most false alarms.
- Consultation. The observatory talks to other experts and, if the anomaly persists, raises the alert level and issues a bulletin with the evidence.
- Civil protection and aviation response. Authorities within the hazard zone update their plans, and ash advisories go to airlines and air traffic control.
- Evacuation when justified. In the worst cases, small areas close to the vent are cleared on a timescale of hours. Larger evacuations need days of preparation, which is exactly why long-term hazard mapping matters so much.
Popocatépetl in 2000 is the clean example of this chain working. Forecasters at Mexico City’s National Center for Prevention of Disasters called an eruption within two days, tens of thousands of people were moved, and the volcano erupted about 48 hours later with no injuries.
The counter-example is just as instructive. Before the 2002 eruption of Nyiragongo, a local expert warned that the volcano would break through the southern flank rather than erupt from the summit, and teams were dispatched. The area was declared safe, and roughly 40 percent of Goma was destroyed by flows that had been assessed as impossible on the flank people actually lived on.
Rabaul in 1994 is the long-warning version: 23 years of unrest produced no usable short-term forecast until the final two years of it. St Helens in 1980 adds the detail everyone remembers. The north flank bulge was measured and rock falls were reported, but the lateral blast and landslide were not anticipated.
Frequently Asked Questions
Can scientists predict exactly when a volcano will erupt?
No. Forecasting narrows the window and states a probability, usually over hours, days or weeks depending on the volcano. Pinatubo gave about ten weeks of escalating unrest; Popocatepetl in 2000 gave about 48 hours. Where magma is poorly imaged or the network is sparse, warning can be much shorter, which is one reason hazard mapping and prepared evacuations matter more than the forecast itself.
Is an increase in earthquakes around a volcano a sign that an eruption is coming?
Often it is a sign that magma is moving, which is why seismicity is the most sensitive precursor. But most earthquake swarms near volcanoes do not end in an eruption. Swarms at Kilauea and Etna are routine. Forecasters care about the trend rather than the count: accelerating seismicity, events migrating shallower, and tremor replacing discrete quakes.
How early can scientists warn people about a volcanic eruption?
It depends on the volcano and its monitoring. Well-instrumented stratovolcanoes often show weeks of unrest, as Pinatubo did in 1991. Basaltic flank eruptions and poorly monitored volcanoes can give hours, as with Nyiragongo in 2002. Caldera systems such as Yellowstone or Campi Flegrei tend to produce years of slow deformation signals that may never lead to an eruption at all.
What is the difference between an eruption forecast and a long-term volcanic hazard assessment?
A forecast is a live statement about the probability and timing of an eruption, updated as data arrives. A hazard assessment is a long-term map of what could be affected if an eruption happens, covering lava, pyroclastic flows, ash and lahars over decades. The forecast drives the next 24 hours; the hazard assessment shapes zoning, building codes and evacuation planning.
Does volcanic activity on a monitoring app mean an eruption is imminent?
Usually not. Most apps simply mirror an alert level, and on frequently active volcanoes such as Etna or Sakurajima, unrest is nearly continuous background noise. An alert of Watch means a volcano is showing signs of heightened unrest, not that an eruption is imminent. Treat automatic notifications as a prompt to read the observatory bulletin, never as the bulletin itself.
Which volcano observatories or agencies should readers trust for local warnings?
Start with the official agency responsible for the volcano in your country. In the United States that is USGS Volcano Hazards and its five Volcano Observatories, with the alert level and aviation colour code published online. Elsewhere it is the national volcano observatory or civil protection agency. Ignore social posts that cite no observatory; they usually recycle old bulletins or confuse unrest with prediction.
Conclusion
Volcano forecasting is a monitoring discipline, not a crystal ball. It works by tracking seismicity, deformation and gas output against a volcano’s own baseline and publishing the probability that those signals translate into an eruption.
If you remember one thing, remember this: what to do first is follow the official observatory or civil protection agency that covers your area, read the bulletin rather than the headline, and know your hazard zone before you ever need it. As of 2026, the tools are better than at any point in the last century, and they still work by widening a margin of error, not by narrowing it to a date.