
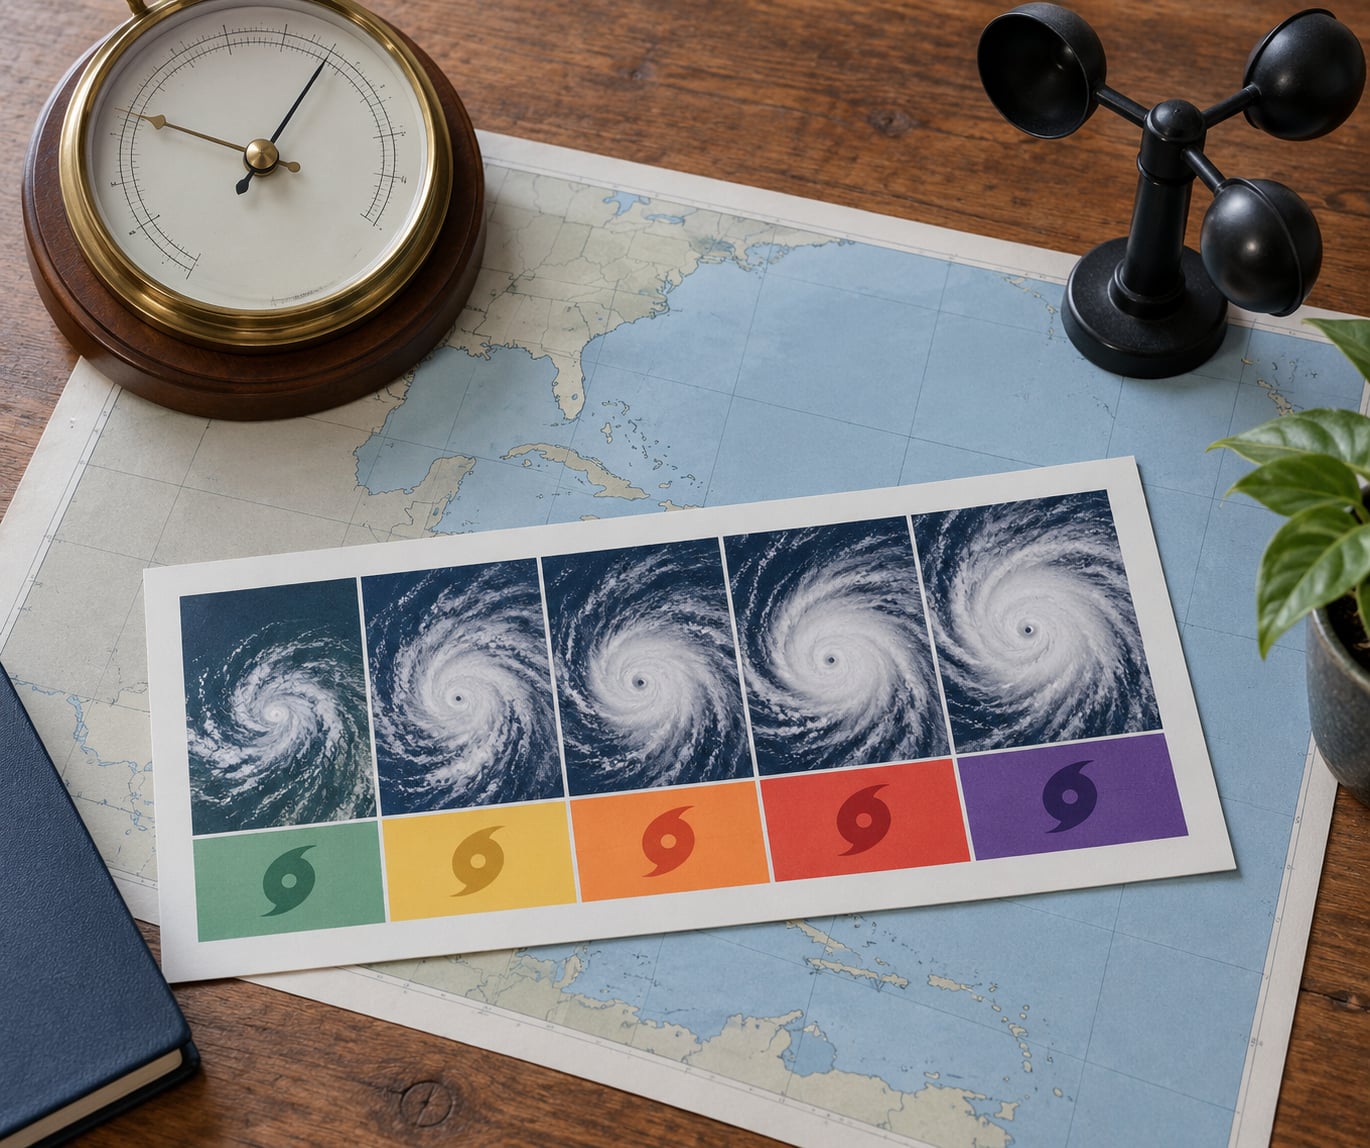
To answer how hurricane categories are measured in one sentence: by the storm’s maximum sustained wind speed, averaged over one minute and read against the Saffir-Simpson Hurricane Wind Scale. That scale assigns Category 1 through Category 5 by wind speed alone, which is why the number says nothing about storm surge, rainfall or how far inland the water reaches.
The gap between that number and the real danger is the part most coverage leaves out. Once you know what the category actually measures, you can read an advisory properly and stop treating a low number as an all-clear.
This guide is current as of 2026 and follows the National Hurricane Center’s published scale. Values are given in miles per hour, with kilometers per hour and knots alongside because advisories mix all three.
Table of Contents
- What Determines a Hurricane’s Category?
- How Are Hurricane Wind Speeds Measured?
- How Does the Saffir-Simpson Hurricane Scale Work?
- Does Central Pressure Measure a Hurricane’s Category?
- How Do Storm Surge, Rainfall, and Size Affect Hurricane Impacts?
- Why Can Two Hurricanes With the Same Category Cause Different Damage?
- Why Do Different Forecast Centers Sometimes Report Different Categories?
- How to Read an Official Hurricane Forecast
- Frequently Asked Questions
- What is a Category 7 hurricane?
- Why are there no Category 6 hurricanes?
- What is considered a Category 6 hurricane?
- Was Katrina a Category 5 hurricane?
- Is storm surge the worst part of a hurricane?
- Is a 300 mph hurricane possible?
- Key Takeaways
What Determines a Hurricane’s Category?
Exactly one variable: sustained wind speed. The Saffir-Simpson Hurricane Wind Scale, created in 1973, sorts tropical cyclones into five categories using the highest sustained wind measured anywhere in the storm, not just at the point of landfall.
That distinction trips people up more than anything else on the page. A storm that peaked at 165 mph over open water and made landfall at 90 mph has two different numbers, and both are legitimately called its category depending on who is speaking.
- Tropical depression: sustained winds under 39 mph
- Tropical storm: 39 to 73 mph, named but not a hurricane
- Category 1: 74 to 95 mph
- Category 3 and above: officially a major hurricane
- Category 5: 157 mph or higher, with no upper limit
The National Hurricane Center is the official authority for the Atlantic and eastern Pacific basins. Category 3 is the threshold that matters for most planning documents because it is where structural damage to well-built homes begins on a consistent basis.
How Are Hurricane Wind Speeds Measured?

No single device produces the official number. Forecasters combine several sources, and the process repeats every six hours. Understanding the chain explains why a storm’s category can change between one advisory and the next.
- The averaging period is fixed first. The United States uses a one-minute average of the wind. Most of the world uses a ten-minute average, and the Western Pacific uses two minutes. The same physical wind produces three different published numbers depending on the standard, which is why a storm described as 130 mph in one report may read 110 mph in another.
- Hurricane hunter aircraft fly the storm. Crewed aircraft from the NOAA Hurricane Hunters and the Air Force reserve unit fly into the circulation, wings folded, to find the eye and the strongest eyewall. Data is transmitted in near real time.
- Dropsondes are released through the eye. Each sonde is a small sensor package dropped from the aircraft. As it falls it measures wind, temperature, pressure and humidity at thousands of feet, which is how forecasters see the storm’s vertical structure rather than just its surface reading.
- Buoys and ships report from the water. Moored buoys measure sustained wind and pressure directly. Their readings are the closest thing to a surface truth in the open ocean, though they sit below the eyewall’s strongest winds and can be pulled down or destroyed by heavy seas.
- Satellites fill the gaps. When aircraft cannot fly, which is most of the time in the eastern Pacific, forecasters use scatterometers, radar, and the Dvorak technique, which estimates intensity from the size and definition of the eye and the banding pattern in satellite imagery. Satellite estimates get adjusted as new observations arrive.
- The center assigns the category and publishes an advisory. Forecasters take the best available sustained wind figure, round it to the nearest applicable threshold, and issue it. Every later advisory can revise the number, either because the storm changed or because better data came in.
After a storm passes, the National Hurricane Center builds a best-track record. Those reanalysis reports are what historians and researchers use, and a storm’s official intensity can be revised upward years later.
How Does the Saffir-Simpson Hurricane Scale Work?

Each category covers a band of sustained wind speeds. The surge column is the National Hurricane Center’s typical range for a well-placed landfall, and it is included here because most versions of this table leave it out and readers need it.
| Category | Sustained wind (mph) | km/h | Knots | Storm surge above normal | Typical damage |
|---|---|---|---|---|---|
| 1 | 74-95 | 120-153 | 64-82 | 4 to 5 feet | Roof and siding damage, downed trees, power failures |
| 2 | 96-110 | 154-177 | 83-95 | 6 to 9 feet | Roof framing damage, mobile homes destroyed, larger trees uprooted |
| 3 | 111-129 | 179-208 | 96-111 | 9 to 12 feet | Roof and wall failure, flooding inland, major structural damage |
| 4 | 130-156 | 209-251 | 113-135 | 13 to 18 feet | Complete roof loss, walls collapsed, homes shifted off foundations |
| 5 | 157 and above | 253 and above | 136 and above | 18 feet or more | Catastrophic, area uninhabitable for weeks or months |
The scale was last amended in 2010, when storm surge and the water depth it produces were removed as a basis for the rating. Units were tweaked in 2013 for Categories 3 through 5. Surge still appears in this table because it is a real consequence of a given category, not because it sets the category.
What the categories do well is give everyone one consistent word for storm strength, so evacuation triggers and insurance rules can reference a single number. What they do not do is sort storms by how dangerous they will be to you.
Does Central Pressure Measure a Hurricane’s Category?
No. Central pressure is reported with every advisory and is a strong clue to intensity, but it is not an input to the Saffir-Simpson Hurricane Wind Scale. The scale takes wind and nothing else.
Lower pressure generally means a stronger storm, and the relationship between pressure and wind is solid enough that a very low central pressure almost always signals a powerful system. It is not exact. Storm size, the shape of the eyewall and where you take the reading all shift the pressure-to-wind balance, which is why a storm can report a remarkably low pressure without matching winds.
Researchers have proposed alternatives. Integrated kinetic energy accounts for how much wind a storm carries across its whole size, which is arguably closer to the quantity that destroys buildings. Central pressure has been proposed as a better predictor of surge. Neither proposal has replaced the wind-based scale, because the wind scale is simple, free of charge and instantly recognizable, and that practical value turns out to be very hard to beat.
How Do Storm Surge, Rainfall, and Size Affect Hurricane Impacts?
Water causes most hurricane deaths. Meteorologists say it constantly, and the numbers back it up, so it is worth separating each water hazard from the wind category that accompanies it but does not measure it.
- Storm surge is ocean water pushed onshore by the storm’s winds. It can exceed the surge range in the table for a weak Category 1 if the land shape funnels it, and it can stay low for a Category 5 that turns offshore. Surge is the fastest killer because it arrives as a wall of water with little warning.
- Rainfall flooding is the quiet one. It happens far inland, where the category stops mattering, and it is frequently the largest death toll of a landfalling storm.
- Tornadoes often spin up in outer rainbands hours before or after landfall, sometimes far from the coast, and carry winds of their own scale.
- Wave action and erosion chew away beaches and dunes long before the wind arrives, undermining the buildings behind them.
- Storm size can matter more than the peak wind. A broad Category 1 with hurricane-force gusts over a wide area can disrupt far more people than a compact, sharper Category 3.
For readers in the Caribbean and on low-lying islands, this is the section to read twice. Islands such as The Bahamas and Turks and Caicos can see surge arrive before the strongest wind ever touches them, and a modest category on a map can mean water reaching a third of the way up a house.
The practical habit worth building: check the surge and rainfall products every single time, in the same alert as the category.
Why Can Two Hurricanes With the Same Category Cause Different Damage?
A category is a property of the atmosphere. Damage is a property of a place. The two meet only where the storm’s wind field overlaps something built by people, and everything about that overlap varies.
Consider landfall category against peak intensity. A storm can reach Category 4 in the middle of the ocean and weaken to Category 2 before it crosses the coast, so the number people remember and the number on the evacuation order are not the same. Conversely, a storm can strengthen right up to the moment it makes landfall, which is exactly when the surge is highest and most of the population is awake.
Beyond the number, six things swing the outcome.
- Distance from the eye. Damage follows a gradient, not a line. One community inside the eyewall and another 40 miles away can be in the same storm and behave like different disasters.
- Building standards. A Category 4 crossing modern reinforced construction in one country and older, unreinforced housing in another produces radically different loss.
- Landfall angle. A storm coming ashore perpendicular to the coast pushes water straight inland. A storm arriving along the shore drives surge along it, with different and sometimes deadlier results.
- Timing and tide. Surge on a low tide reaches only so far. Surge at high tide starts from a higher water level and overtops where it otherwise would not.
- Population exposure. Where people live relative to the water matters as much as what the water does.
- Preparedness. Evacuation order, shelter quality and how long people leave decide outcomes that the atmosphere has no say in.
That is why an honest explanation of hurricane categories has to end with the water.
Why Do Different Forecast Centers Sometimes Report Different Categories?
It happens often enough that news outlets regularly appear to contradict themselves. In most cases both numbers are correct and they describe different things.
- Different basins use different authorities. The National Hurricane Center handles the Atlantic and eastern Pacific, the Central Pacific Hurricane Center covers the central Pacific, and the Joint Typhoon Warning Center covers the western Pacific. Japan Meteorological Agency and China Meteorological Administration run their own regional systems.
- Averaging periods differ. One minute in the United States, two minutes in the western Pacific, ten minutes in much of the world. A two-minute average runs higher than a one-minute average for the same gust.
- Different measurement windows. Two centres may average the same storm over different time blocks, and a peak hour can move a category boundary.
- Post-storm revision. The National Hurricane Center’s best-track reanalysis can raise a storm’s intensity after landfall, which is why research papers and older news stories disagree.
In the western Pacific the word itself shifts. A storm there is called a typhoon, and one with sustained winds above about 150 mph is often labelled a super typhoon, a term with no equivalent in the Atlantic. JMA and China use their own five-level scales, so a single storm can carry three different category numbers depending on whose page you are reading.
How to Read an Official Hurricane Forecast
Advisories pack a great deal into a small space, and the headline category is the least complicated item in it. A useful reading order looks like this.
- Find the current category and its timestamp. Check whether the figure refers to the storm’s peak so far this cycle or to the expected intensity at landfall. Those are different numbers and forecasts usually state both.
- Read the forecast cone for timing, not for size. The cone shows where the center is likely to be, and its shape is a probability swath of the storm’s center, not a boundary of the damaging wind field. Winds often extend far beyond it.
- Find the wind speed and radius. Forecasts list the strongest sustained wind and often how far that wind extends from the center. A broad wind field threatens more people than the category suggests.
- Check the storm surge products. Surge watch and warning maps show water heights above normal tide for specific coastal areas, often in a higher resolution than the cone.
- Read the rainfall outlook separately. This is the number that matters most for inland flooding, and it is often the one that gets skipped in television coverage.
- Follow local instructions over national ones. Evacuation routes, shelter hours and zone maps come from your local emergency management, not from the forecast centre.
One habit closes most of the loop: treat the advisory as a snapshot, not a verdict. A storm can intensify quickly, weaken just as fast, or shift its track, and the next advisory six hours later may tell a different story.
Frequently Asked Questions
What is a Category 7 hurricane?
There is no Category 7, and there cannot be one under the current Saffir-Simpson Hurricane Wind Scale, which has five categories. Category 5 begins at 157 mph and has no upper limit, so every stronger storm on record falls inside Category 5 rather than spilling into a sixth or seventh band. A Category 7 would require officially adding new thresholds above 157 mph, which the National Hurricane Center has not done.
Why are there no Category 6 hurricanes?
Because the scale stops at five, and Category 5 is open-ended: it covers 157 mph and everything above it. Nothing in the scale’s design leaves a gap for a stronger class to occupy. Meteorologists have argued the design is a weakness, because a storm at 160 mph and one at 200 mph both receive the same label. The National Hurricane Center has kept the five-category scale for its simplicity and wide recognition.
What is considered a Category 6 hurricane?
Nothing official yet. Researchers including Michael Wehner and James Kossin proposed in 2024 a Category 6 for storms above roughly 200 mph, based on their analysis of Atlantic and Pacific records from 1980 to 2021. They identified five storms in that window that would have qualified, and projected sharp increases in such storms under continued warming. Until the scale is amended, all of them are recorded as Category 5.
Was Katrina a Category 5 hurricane?
Yes. Katrina peaked at Category 5 strength over the Gulf of Mexico in 2005, and it has been retroactively assessed slightly higher than the estimate issued at the time. It made final landfall in Louisiana as a Category 3. That gap is the clearest example of why a storm’s peak category and its landfall category are quoted separately.
Is storm surge the worst part of a hurricane?
In most disasters, yes. Flooding from surge and rain accounts for the large majority of hurricane deaths, because water rises quickly, covers roads and enters buildings before anyone can react. Surge has also proven unpredictable from category alone, since it depends on coastline shape, seabed slope and tide as much as on wind. Treat surge warnings as seriously as the wind forecast.
Is a 300 mph hurricane possible?
No hurricane has produced sustained winds anywhere near 300 mph. The strongest sustained winds reliably recorded in the Atlantic fall in the low to mid 190s, and the theoretical ceiling for a tropical cyclone is far below 300 mph because a rotating atmosphere cannot sustain winds that extreme. The number circulates online, but it describes gusts recorded on non-tropical, tornado-generated wind systems rather than hurricane conditions.
Key Takeaways
Hurricane categories are measured by maximum sustained one-minute wind speed against the Saffir-Simpson Hurricane Wind Scale, and nothing else enters the calculation. That is the whole rule, and every number in a headline advisory comes from it.
What you do with that number is the separate decision. Read the surge and rainfall products every time, note whether the figure describes peak intensity or landfall, and follow evacuation guidance from local authorities rather than inferring risk from the category alone.


